Owens & Minor Inc (OMI) - Market Cap to Earnings
Symbol and logo of brand Owens & Minor Inc (OMI)

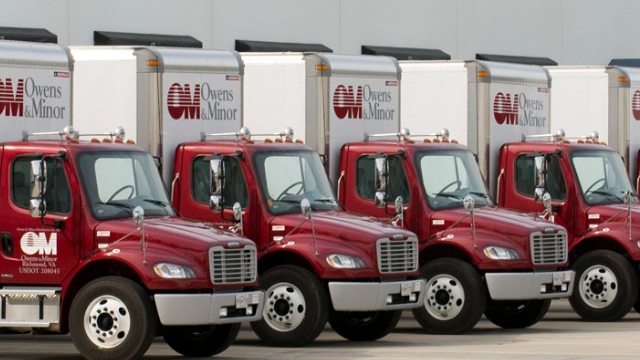
Logistics operator Owens & Minor, Inc. (OMI) delegates its fleet services to external centers to eliminate dependency risks. This price action on GURU.Markets, visualized for analytical convenience with the -0.20 indicator, helps monitor this sector. The business relies on wholesale medical supply deliveries and the production of its own apparel. Management is effectively reducing debt following merger deals while maintaining high profitability across B2B streams.

owens-minor.com (OMI): Price to Earnings Ratio from 07/04/2022 to 01/02/2026

Comprehensive metric breakdowns and analytics for Owens & Minor, Inc. (OMI)
- market capitalization indicators:
Comprehensive company analysis:OMI (Owens & Minor Corp)
Finished products of Owens & Minor Healthcare

The long-term sustainability of Owens & Minor, Inc. (OMI) is determined by the business's ability to generate stable profit per unit of market value. The price-to-earnings ratio, reflected in the company's current market P/E, measures the investment payback period and the risk of overpaying for the asset. This metric allows for the timely identification of a value trap during price declines. Low margins in medical supply logistics and high infrastructure costs make this indicator critical for assessing the efficiency of this capital-intensive business.

Competing companies

UNP: Company Value to Net Income|P/E Multiple PLD|P/E Multiple Canadian Pacific Railway (CP)|P/E Multiple NSC (NSC Corp)|P/E Multiple CSX Corporation CSX|CNI - Price to Earnings Ratio|PCAR - P/E Multiple|PSA (Public Storage, Inc.) - Price to Earnings Ratio|C.H. Robinson - Company Value to Net Income|XPO (xpo.com) - P/E Multiple|UHAL (U-Haul Holding Company) - Market Price to Net Income Ratio|P/E Multiple SAIA|TFII (TransForce) - Company Value to Net Income|P/E Multiple R (ryder.com)|KNX: Price to Earnings Multiple|GATX Corporation - P/E Multiple|LSTR - P/E Multiple|SNDR: P/E Multiple|RXO Corp - Company Value to Net Income|TRN (Trinity Rail) - P/E Multiple|Price to Earnings Multiple WERN (Werner Logistics)|Price to Earnings Ratio Distribution Solutions Group Inc (DSGR)|Business Payback Period scansource.com|Price to Earnings Ratio Heartland Express, Inc. HTLD|Hyster-Yale (HY) - Market Cap to Earnings|Universal Logistics Holdings, Inc. - P/E Multiple|CVLG (Covenant Logistics) - Price to Earnings Multiple|WNC: P/E Multiple|Radiant - Company Value to Net Income|Price to Earnings Ratio PAM Transportation|PAL (Proficient Auto Logistics, Inc.) - Market Price to Net Income Ratio|Price to Earnings Ratio FreightCar America, Inc (RAIL)|YGMZ - Market Cap to Earnings|Eastern International - Price to Earnings Ratio|HXHX: Price to Earnings Multiple|ATXG - Price to Earnings Ratio|Company Value to Net Income CTNT (Cheetah Net Supply Chain Corp.)|EZFill Holdings Inc. (EZFL) - Price to Earnings Ratio|Nikola Corp - Company Value to Net Income|Price to Earnings Ratio P.A.M. Transportation Services, Inc.|P/E Multiple Daseke, Inc.