OMI - Owens & Minor Inc Market Cap to Revenue
Corporate company logo of Owens & Minor Healthcare (OMI)

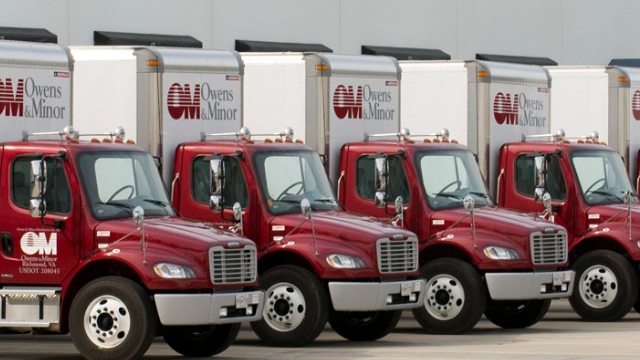
Owens & Minor, Inc. (OMI) demonstrates reliability through its extensive network of medical centers and the optimization of ground logistics. The company's P/S ratio dynamics confirm this trend, where 0.00 represents the current level of the metric. Management's strategy of acquiring new assets enhances profitability, while warehouse automation during the period of market normalization effectively reduces transportation costs, stabilizing overall business performance.

OMI Owens & Minor Inc Price-to-Revenue Ratio (07/04/2022 - 01/02/2026)

Owens & Minor, Inc. (OMI) - metric breakdowns and financial figures
- current quotes and average value forecast:
Analysis of all company metrics:Owens & Minor Corp
Core merchandise of Owens & Minor Healthcare

The implementation of robotic warehouses and AI routing within Owens & Minor, Inc. (OMI) logistics reduces operating expenses, directly impacting revenue generation efficiency. By analyzing historical P/S dynamics, an investor determines the value of a single dollar of sales, which allows them to distinguish asset undervaluation from systemic business decline and assess the stability of market quotes relative to the company's actual scale of operations.

Who Owens & Minor, Inc. competes with

P/S Multiple Union Pacific Corporation (UNP)|Price-to-Revenue Ratio Prologis Corp PLD|CP: Market Cap to Revenue Ratio|NSC - Price-to-Revenue Ratio|CSX (CSX Corp) - Market Cap to Revenue Ratio|CNI: P/S Multiple|Market Cap to Revenue PACCAR|PSA (Public Storage Corp) - P/S Multiple|C.H. Robinson Worldwide (CHRW) - Price-to-Revenue Coefficient|Price-to-Revenue Ratio XPO Corp (XPO)|P/S Multiple amerco.com (UHAL)|P/S Multiple SAIA (Saia LTL Freight)|TFII: Market Cap to Revenue Ratio|R: Market Cap to Revenue|Price-to-Revenue Coefficient Knight-Swift Transportation KNX|General American Transportation Corporation (GATX) - Price-to-Revenue Ratio|Landstar - Market Capitalization-to-Revenue Ratio|Price-to-Revenue Ratio Schneider National|Market Cap to Revenue Ratio RXO (rxo.com)|P/S Multiple TRN|Market Cap to Sales Volume WERN|Price-to-Revenue Ratio distributionsolutionsgroup.com DSGR|Market Capitalization-to-Revenue Ratio SCSC|HTLD: Market Cap to Revenue|HY (Hyster-Yale, Inc.) - Market Cap to Revenue Ratio|ULH: P/S Multiple|CVLG - Price-to-Revenue Coefficient|Price-to-Revenue Ratio Wabash National|RLGT (Radiant Logistics, Inc.) - Market Cap to Sales Volume|Price-to-Revenue Ratio PAM Transport (PAMT)|PAL (Proficient Auto Logistics Inc) - Market Capitalization-to-Revenue Ratio|P/S Multiple RAIL (FreightCar)|YGMZ - Market Cap to Revenue|Eastern International Ltd. - P/S Multiple|HXHX: Price-to-Revenue Ratio|Addentax (ATXG) - Price-to-Revenue Ratio|Price to Sales Cheetah Net Supply Chain (CTNT)|EZFL (getyourezfill.com) - P/S Multiple|Market Cap to Revenue Ratio NKLA (Nikola Motor Company)|Price-to-Revenue Ratio P.A.M. Transportation Services, Inc. (PTSI)|Price-to-Revenue Coefficient Daseke