ONC: BeiGene Ltd. Price-to-Revenue Coefficient

Corporate company logo of BeiGene Ltd. (ONC)

BeiGene Ltd is developing advanced oncology treatments through strategic partnerships and molecule licensing. The divergence of the P/S ratio from its historical average illustrates the market valuation, where the current level is 6.60. A global approach to clinical trials accelerates the launch of affordable drugs, yet strict government price controls and colossal R&D expenditures pose significant challenges to business margins.

BeiGene Corp (ONC) P/S Multiple: for the period 07/04/2022 - 11/13/2026
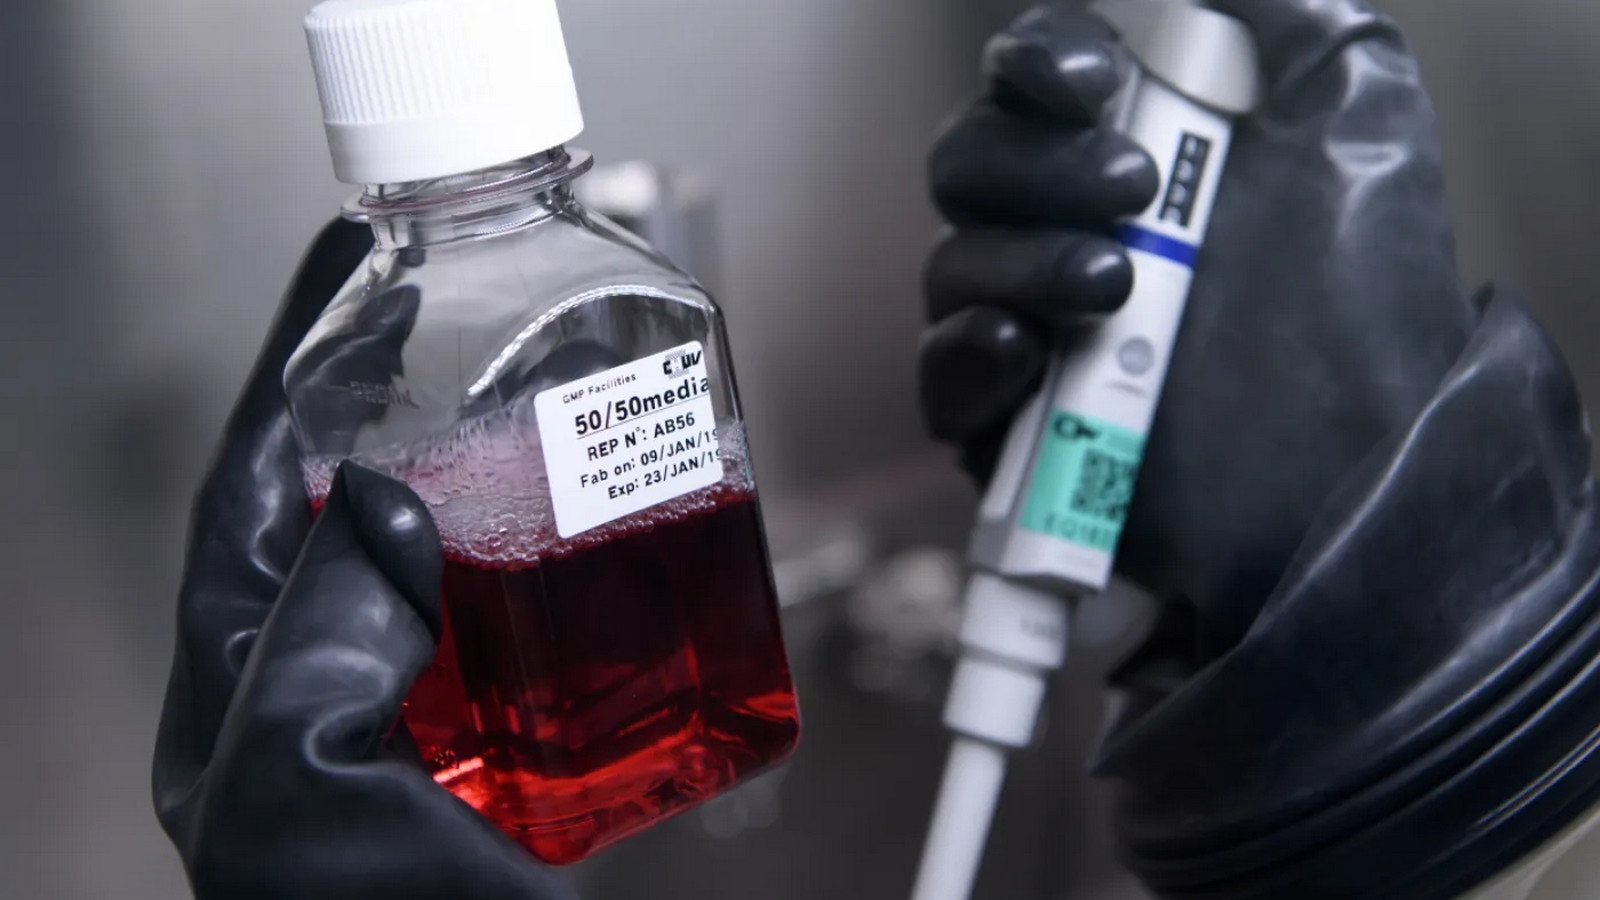
Manufactured products of BeiGene

Efficient international logistics and production diversification at BeiGene Ltd (ONC) ensure steady revenue growth, making the business valuation based on sales a key indicator of resilience. By analyzing the P/S multiple, an investor can see the ratio of market capitalization to sales volume, which helps determine the degree of overpayment for the asset and assess market expectations regarding the scaling of the company's operations.

Competitors of BeiGene Ltd

HALO - Price to Sales|P/S Multiple RVMD (Revolution Medicines, Inc.)|Price-to-Revenue Coefficient Ascentage Pharma Group International (AAPG)|CG Oncology Corp - P/S Multiple|Price-to-Revenue Multiple UroGen Pharma Corp (URGN)|BCAX: P/S Multiple|Price to Sales personalis.com (PSNL)|Price-to-Revenue Ratio Erasca|Market Cap to Revenue Ratio DCTH (Delcath Systems Inc)|P/S Multiple YMAB|AURA - Price to Sales|Candel Therapeutics, Inc. - Market Cap to Revenue|Market Capitalization-to-Revenue Ratio ARAY|SLS - Price-to-Revenue Ratio|ACTU: Price-to-Revenue Ratio|CTOR (Citius Oncology, Inc) - Market Cap to Revenue|HURA: Market Cap to Sales Volume|TARA (Protara Therapeutics) - P/S Multiple|Market Cap to Revenue Ratio FATE (fatetherapeutics.com)|Price-to-Revenue Ratio Aadi Bioscience Inc (WHWK)|TCRX - Price to Sales|Price-to-Revenue Ratio Champions Oncology, Inc. CSBR|XBIT: Market Cap to Revenue Ratio|CEL-SCI Corp - P/S Multiple|ostherapies.com (OSTX) - Market Cap to Revenue|RADX: P/S Multiple|Market Cap to Revenue Artiva Biotherapeutics|ANL (Adlai Nortye Ltd) - P/S Multiple|P/S Multiple Veru Corporation|Price-to-Revenue Ratio Tempest Therapeutics (TPST)|xiliotx.com - Market Cap to Revenue Ratio|P/S Multiple RENB (Renovaro)|MURA - Market Cap to Revenue|Kairos Pharma Inc - P/S Multiple|Price to Sales OnKure Therapeutics Inc|w2.cytomed.sg (GDTC) - Price-to-Revenue Ratio|Curis - Market Capitalization-to-Revenue Ratio|Market Cap to Revenue APLM|THAR: Market Capitalization-to-Revenue Ratio|P/S Multiple ADVB|Market Cap to Revenue Genprex Inc GNPX|Calidi Biotherapeutics, Inc. - Market Cap to Revenue|P/S Multiple sunshinebiopharma.com SBFM|XBIO - Price-to-Revenue Ratio|Market Capitalization-to-Revenue Ratio SLRX (Salarius Pharmaceuticals Inc)|PPBT: P/S Multiple|Price to Sales American Oncology Network, Inc. (AONC)|BGNE (BeiGene, Ltd.) - P/S Multiple|Price-to-Revenue Ratio CKPT|P/S Multiple ELEV|ICAD - Price to Sales|P/S Multiple IKNA (Ikena Oncology)|Price-to-Revenue Coefficient Notable Labs Corp (NTBL)|Viracta - P/S Multiple|Price-to-Revenue Multiple morphosys.com (MOR)|NAYA: P/S Multiple|Price to Sales Ascentage Pharma Group International (AAPGV)