ARAY: Accuray Inc Market Cap to Revenue
Corporate company logo of Accuray Inc (ARAY)

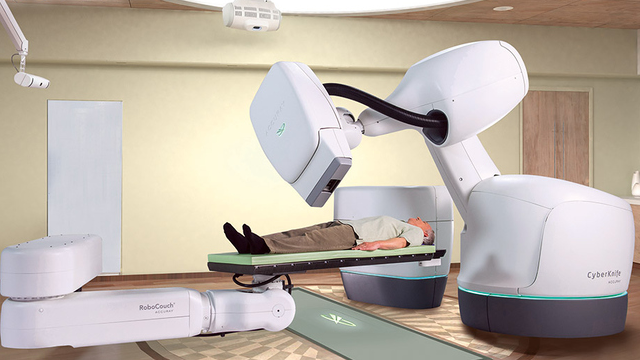
The development of exclusive CyberKnife robots allows Accuray Incorporated (ARAY) to implement premium pricing. On GURU.Markets, the company's rolling P/S captures the impact of this strategy, where 0.00 shapes the current metric. A stable brand image within the oncology community and low sensitivity to macroeconomic shocks, driven by long-term government equipment procurement, ensure the resilience of the asset's quotes.

ARAY Accuray Incorporated: Market Cap to Revenue in the range 07/04/2022 - 11/13/2026

Analytical breakdowns for Accuray Inc. (ARAY)
- stock value and consensus price forecast:
- market capitalization information:
Summary company analytics:ARAY - accuray.com
Finished products of Accuray Inc.

The P/S multiple determines the market value of Accuray Incorporated relative to its annual sales volume, measuring the premium investors are willing to pay per unit of revenue. By analyzing the price-to-sales ratio, one can assess the fairness of the capitalization of this high-tech business, where the value of CyberKnife systems and the precision of radiosurgery should be reflected in the company's valuation dynamics relative to industry standards.

Who Accuray Incorporated competes with

P/S Multiple beigene.com (ONC)|P/S Multiple HALO (Halozyme)|RVMD - Market Cap to Revenue|Ascentage - P/S Multiple|CG Oncology Therapeutics (CGON) - Market Cap to Revenue|URGN (UroGen Pharma Ltd.) - Market Cap to Revenue|bicara.com (BCAX) - P/S Multiple|Price-to-Revenue Ratio Personalis|ERAS: Market Capitalization-to-Revenue Ratio|P/S Multiple DCTH|P/S Multiple Y-mAbs Corp (YMAB)|Aura Biosciences, Inc. - Market Cap to Revenue|Candel Therapeutics Inc. (CADL) - Price to Sales|SLS: Market Cap to Revenue|Market Capitalization-to-Revenue Ratio ACTU (Actuate Therapeutics Inc.)|CTOR: P/S Multiple|HURA - Price-to-Revenue Coefficient|Price-to-Revenue Ratio Protara Therapeutics|Market Cap to Revenue Ratio FATE (fatetherapeutics.com)|P/S Multiple WHWK|Market Cap to Revenue tscan.com TCRX|Price-to-Revenue Ratio Champions Oncology, Inc. CSBR|XBiotech Inc (XBIT) - Price to Sales|CVM - Price-to-Revenue Ratio|Market Capitalization-to-Revenue Ratio OSTX (ostherapies.com)|Radiopharm Theranostics (RADX) - Price-to-Revenue Ratio|Price-to-Sales Ratio ARTV (Artiva Biotherapeutics)|Price-to-Revenue Ratio Adlai Nortye Ltd|Price to Sales Veru Corporation VERU|Price-to-Revenue Ratio Tempest Therapeutics (TPST)|XLO (xiliotx.com) - Market Capitalization-to-Revenue Ratio|P/S Multiple RENB (Renovaro)|P/S Multiple Mural Oncology PLC MURA|KAPA: Market Cap to Revenue|OnKure Therapeutics Inc - Market Cap to Sales Volume|GDTC: P/S Multiple|Price to Sales Curis (CRIS)|APLM (Apollomics Inc.) - P/S Multiple|Market Cap to Revenue Ratio THAR (Tharimmune Inc)|P/S Multiple ADVB|P/S Multiple Genprex Inc (GNPX)|Price-to-Revenue Ratio Calidi Biotherapeutics, Inc. CLDI|Market Capitalization-to-Revenue Ratio SBFM|Xenetic Bio - P/S Multiple|SLRX - P/S Multiple|PPBT (Purple Biotech Corp) - Market Cap to Revenue|Price to Sales American Oncology Network, Inc. (AONC)|BGNE (BeiGene, Ltd.) - P/S Multiple|Market Cap to Revenue checkpointtx.com (CKPT)|P/S Multiple ELEV|P/S Multiple icadmed.com (ICAD)|Price-to-Revenue Ratio Ikena Oncology IKNA|NTBL: Market Cap to Revenue Ratio|Viracta - P/S Multiple|morphosys.com (MOR) - Market Cap to Revenue|NAYA: P/S Multiple|Price to Sales Ascentage Pharma Group International (AAPGV)