O'Reilly Auto (ORLY) Price-to-Projected Revenue Ratio

O'Reilly Auto (ORLY) - corporate logo

O'Reilly Automotive (ORLY) profits from servicing the aging US vehicle fleet through both its B2B segment and retail operations. Demand is sustained by a defensive cycle, as owners purchase new vehicles less frequently and opt for repairs instead. Skilled management and transparent share buybacks ensure business efficiency. The expected price-to-sales ratio demonstrates valuation dynamics, where the value of 3.60 reflects this status.

ORLY O'Reilly: Price-to-Projected Revenue Ratio in the range 07/04/2022 - 11/13/2026

Comprehensive metric breakdowns and analytics for O'Reilly Auto (ORLY)
- current price and projected stock value:
Fundamental company analysis:O'Reilly Auto Parts (ORLY)
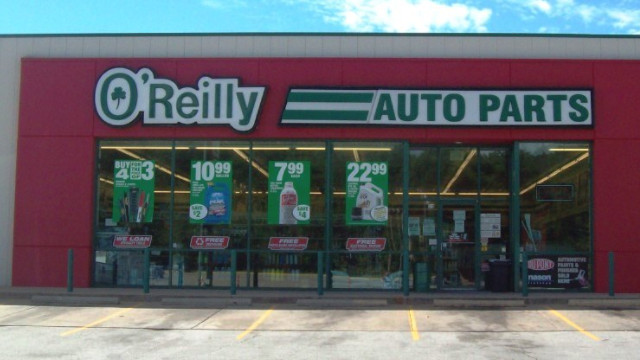
Manufactured products of O'Reilly Auto

The forward P/S ratio relates the current market value of the business to expected revenue, reflecting the premium the market is willing to pay for future growth. For O'Reilly Automotive (ORLY), this multiple confirms the efficiency of distribution scaling, where sales growth through existing locations optimizes logistics costs. By analyzing the forward P/S metric, an investor can assess the balance between growing confidence in operating leverage and the reduction of the asset's margin of safety.

Competitors of O'Reilly Automotive

Forward P/S Multiple AZO (AutoZone)|Market Cap to Expected Sales Ratio Cummins Inc (CMI)|GPC - Price-to-Projected Revenue Ratio|MGA: Price-to-Projected Revenue Ratio|RBC Bearings (RBC) - Price-to-Projected Revenue Ratio|ALV (autoliv.com) - Price-to-Projected Revenue Ratio|Forward Price-to-Revenue Multiple BWA|Market Cap to Future Revenue Ratio LKQ Corporation Inc. LKQ|Forward Price-to-Revenue Multiple ALSN (Allison Transmission Corp)|LEA (Lear Automotive) - Forward Price to Sales|Forward P/S Multiple VVV (Valvoline Inc.)|Forward P/S Multiple dormanproducts.com DORM|ATMU: Forward Price-to-Revenue Multiple|AAP - Forward P/S Multiple|DRVN (Take 5 Oil Change) - Forward Price-to-Revenue Multiple|DAN: Price to Expected Revenue Ratio|Price-to-Projected Revenue Ratio Garrett Motion Inc.|Market Cap to Future Revenue Ratio The Goodyear Tire & Rubber GT|Price-to-Projected Revenue Ratio PHINIA (PHIN)|Forward Price-to-Revenue Multiple Adient PLC ADNT|Price-to-Projected Revenue Ratio Fox Factory Holding Corp. FOXF|XPEL Corp (XPEL) - Market Cap to Future Revenue Ratio|SMP: Forward Price-to-Revenue Multiple|aam.com - Price to Expected Revenue Ratio|CPS: Forward P/S Multiple|MNRO - Market Cap to Expected Sales Ratio|Forward Price-to-Revenue Multiple HLLY|Price-to-Projected Revenue Ratio MPAA|Forward P/S Multiple CAAS|MTEN - Market Cap to Future Revenue Ratio|Price-to-Projected Revenue Ratio Sypris SYPR|CarParts com, Inc. (PRTS) - Market Cap to Future Revenue Ratio|WPRT - Price-to-Projected Revenue Ratio|Forward Price to Sales WKSP (Worksport Ltd.)|INNEOVA Holdings Ltd (INEO) - Price-to-Projected Revenue Ratio|CREV (Carbon Revolution Public Limited Company) - Price-to-Projected Revenue Ratio|Forward Price-to-Revenue Multiple SUP|Market Cap to Future Revenue Ratio SAG Holdings Ltd. SAG