OXM: Oxford Corp Market Cap to Revenue Ratio

Brandmark of Oxford Industries Inc (OXM)

Premium resort-style brands and the expansion of direct-to-consumer sales form the foundation of growth for Oxford Industries, Inc. (OXM). The company's historical P/S ratio confirms this resilience, while 0.30 reflects the metric's most recent value. The model is based on the full outsourcing of production to Asia, while the high margins of digital retail offset the risks associated with a narrowly specialized brand portfolio.

Oxford Corp (OXM): Price-to-Revenue Ratio from 07/04/2022 to 11/17/2026

Analytical breakdowns for Oxford Corp (OXM)
- stock price and consensus target price:
Fundamental company analysis:OXM - Oxford Industries Inc
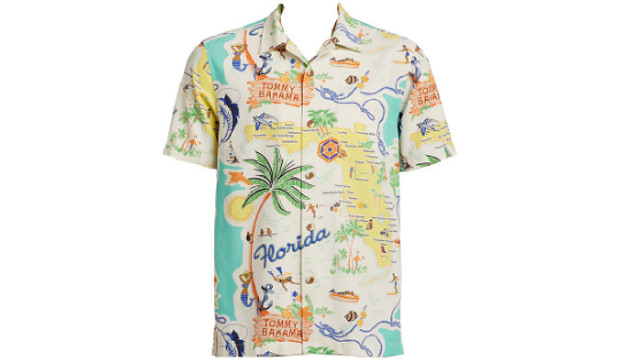
Manufactured products of Oxford Industries Inc

The P/S multiple determines the market value of a business per unit of generated revenue, allowing an investor to assess the degree of overpayment for an asset via the current value of 0.30. An analysis of the market capitalization-to-revenue ratio confirms the efficiency of logistics robotization at Oxford Industries, Inc. (OXM), where hub automation reduces costs, optimizing the company's fundamental value and minimizing capital freeze risks.

Competitors of Oxford Industries, Inc.

Nike - Market Cap to Revenue Ratio|P/S Multiple TPR (Tapestry, Inc.)|LULU: Market Cap to Revenue Ratio|RL - Price-to-Revenue Ratio|DECK (Deckers Brands) - Market Cap to Revenue Ratio|On Running (ONON) - Price-to-Revenue Ratio|SKX - Price-to-Revenue Coefficient|Price-to-Revenue Ratio Levi Strauss & Co|Gildan Corp (GIL) - Price-to-Revenue Coefficient|P/S Multiple VFC|Kontoor Brands - Market Cap to Revenue Ratio|Price-to-Revenue Ratio Crocs Corp CROX|Market Capitalization-to-Revenue Ratio PVH|ZGN - Price-to-Revenue Ratio|Price-to-Revenue Coefficient UniFirst Uniforms UNF|columbia.com (COLM) - Price-to-Revenue Ratio|CPRI - Price-to-Revenue Coefficient|WWW (Wolverine World Wide, Inc.) - P/S Multiple|Market Cap to Revenue Ratio SHOO (Steven Madden Ltd)|P/S Multiple HBI|Price-to-Revenue Coefficient Victoria's Secret Corp|Price-to-Revenue Ratio Under Armour Inc UA|Price-to-Revenue Multiple Canada Goose Apparel|FIGS: Market Cap to Revenue|Price-to-Sales Ratio GIII|CRI: P/S Multiple|Price-to-Revenue Multiple Guess? Inc. GES|Price-to-Revenue Ratio Movado Corp|Weyco Group - Price-to-Sales Ratio|Price-to-Revenue Ratio Lanvin Group Holdings (LANV)|Price-to-Revenue Coefficient Rocky Brands Inc|Price-to-Revenue Ratio Torrid Holdings Inc. CURV|SGC (Superior Group of Companies) - Price-to-Sales Ratio|PLCE: Market Cap to Revenue|Price-to-Revenue Coefficient fossilgroup.com FOSL|Duluth Holdings (DLTH) - Price-to-Revenue Ratio|LAKE: Market Cap to Sales Volume|Market Cap to Revenue SORA|Market Cap to Revenue a.k.a. Brands Inc (AKA)|P/S Multiple UFI|Price-to-Revenue Ratio VRA (Vera Bradley Inc.)|Price-to-Revenue Ratio Jerash Holdings US Inc JRSH|VNCE (vince.com) - Price-to-Sales Ratio|TLF - Price-to-Revenue Ratio|Price-to-Revenue Multiple lulus.com (LVLU)|BRIA: P/S Multiple|Market Cap to Revenue Ratio FMFC|Price-to-Revenue Ratio Majestic Ideal Holdings|Price-to-Revenue Ratio MGOL