SGC: Superior Uniform Group Market Cap to Revenue Ratio
Brandmark of Superior Uniform Group (SGC)

Superior Group of Companies (SGC) relies on long-term B2B agreements with clinics that ensure a steady client flow. Industrial scale and in-house capacities enable the company to profitably supply massive batches of uniforms. The price-to-sales ratio captures the market consensus, with the metric currently at 0.40. The geographic distribution of factories across the US, Haiti, and El Salvador minimizes strike risks, as reflected in the chart's price action.

Superior Group of Companies, Inc. (SGC): Price-to-Revenue Ratio from 07/04/2022 to 11/18/2026

Metric breakdowns and analytics for Superior Uniform Group (SGC)
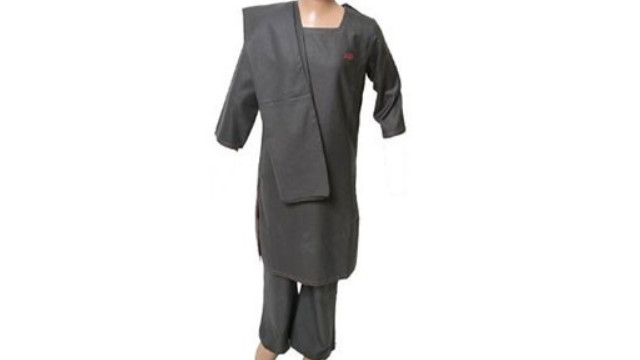
Signature product of Superior Group of Companies Inc.

The P/S multiple is calculated as the ratio of market capitalization to total sales, measuring the value of each dollar of revenue in the eyes of investors. The stability of the core team of designers and logisticians at Superior Group of Companies (SGC) supports operational efficiency, which allows the current P/S multiple to assess the extent to which the company's market value aligns with its actual business scale.

Competitors of Superior Group of Companies

Nike - Market Cap to Revenue Ratio|P/S Multiple TPR (Tapestry, Inc.)|LULU: Market Cap to Revenue Ratio|RL - Price-to-Revenue Ratio|DECK (Deckers Brands) - Market Cap to Revenue Ratio|On Running (ONON) - Price-to-Revenue Ratio|SKX - Price-to-Revenue Coefficient|Price-to-Revenue Ratio Levi Strauss & Co|Gildan Corp (GIL) - Price-to-Revenue Coefficient|P/S Multiple VFC|Kontoor Brands - Market Cap to Revenue Ratio|Price-to-Revenue Ratio Crocs Corp CROX|Market Capitalization-to-Revenue Ratio PVH|ZGN - Price-to-Revenue Ratio|Price-to-Revenue Coefficient UniFirst Uniforms UNF|columbia.com (COLM) - Price-to-Revenue Ratio|CPRI - Price-to-Revenue Coefficient|WWW (Wolverine World Wide, Inc.) - P/S Multiple|Market Cap to Revenue Ratio SHOO (Steven Madden Ltd)|P/S Multiple HBI|Price-to-Revenue Coefficient Victoria's Secret Corp|Price-to-Revenue Ratio Under Armour Inc UA|Price-to-Revenue Multiple Canada Goose Apparel|FIGS: Market Cap to Revenue|Price-to-Sales Ratio GIII|CRI: P/S Multiple|Price-to-Revenue Multiple Guess? Inc. GES|Price-to-Revenue Ratio oxfordinc.com|Movado Group - Price-to-Sales Ratio|Market Cap to Revenue WEYS (Weyco Group Inc.)|LANV: Price-to-Sales Ratio|Rocky Brands, Inc. - Market Cap to Revenue|CURV: Market Cap to Revenue Ratio|PLCE: Market Cap to Revenue|Price-to-Revenue Coefficient fossilgroup.com FOSL|Duluth Holdings (DLTH) - Price-to-Revenue Ratio|LAKE: Market Cap to Sales Volume|Market Cap to Revenue SORA|Market Cap to Revenue a.k.a. Brands Inc (AKA)|P/S Multiple UFI|Price-to-Revenue Ratio VRA (Vera Bradley Inc.)|Price-to-Revenue Ratio Jerash Holdings US Inc JRSH|VNCE (vince.com) - Price-to-Sales Ratio|TLF - Price-to-Revenue Ratio|Price-to-Revenue Multiple lulus.com (LVLU)|BRIA: P/S Multiple|Market Cap to Revenue Ratio FMFC|Price-to-Revenue Ratio Majestic Ideal Holdings|Price-to-Revenue Ratio MGOL