SHEL 📈 Analysis and forecast of the company's shares 📉 Shell plc
GURU.Markets stock price, segment price, and overall market index valuation
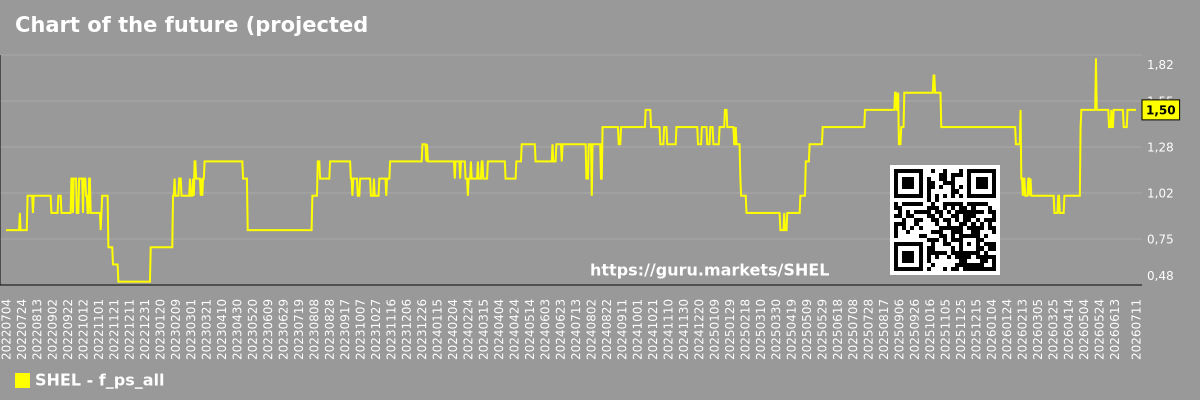
The company's share price Shell plc
Shell, like other oil and gas majors, sees its share price fluctuate with energy prices. Its value is determined by production volumes, refinery efficiency, and, increasingly, by its success in investing in renewable energy and LNG (liquefied natural gas).

Share prices of companies in the market segment - Oil and gas exploration
Shell is one of the world's largest oil and gas companies, spanning segments from production to refining and fuel sales. We classify it as part of the Oil and Gas Exploration sector, and the chart below reflects the overall dynamics of the oil and gas industry, which are dependent on energy prices.

Broad Market Index - GURU.Markets
Shell is one of the world's largest energy giants, actively investing in the transition from fossil fuels to renewable energy. Its scale makes it an important component of the GURU.Markets index. The chart below represents the entire market. See how Shell compares to it.

Change in the price of a company, segment, and market as a whole per day
SHEL - Daily change in the company's share price Shell plc
The daily price change for Shell, an energy major, reflects its high sensitivity to oil prices and news about the transition to green energy. The chart of these fluctuations is unspectacular, but it is an important component of the formulas on System.GURU.Markets.

Daily change in the price of a set of shares in a market segment - Oil and gas exploration
Shell plc is one of the largest players in the volatile energy sector. This chart reflects the average daily performance of the entire oil and gas industry. Comparing it to SHEL shares helps us understand how the company's strategy for transitioning to green energy affects its sensitivity to fossil fuel prices.

Daily change in the price of a broad market stock, index - GURU.Markets
Shell is one of the world's largest oil and gas companies, actively investing in the transition to green energy. Its stock price is closely linked to oil and gas prices. The chart below illustrates overall market volatility, which is strongly influenced by the energy sector, represented by Shell.

Dynamics of market capitalization of the company, segment and the market as a whole over 12 months
Annual dynamics of the company's market capitalization Shell plc
Shell, one of the world's largest energy giants, has balanced investments in traditional fossil fuels and renewable energy development over the past year. Its share price performance has reflected oil and gas prices, as well as market sentiment toward its energy transition strategy.

Annual dynamics of market capitalization of the market segment - Oil and gas exploration
Shell plc, one of the world's leading energy companies, is actively investing in the transition to low-carbon energy sources without abandoning its traditional oil and gas business. The chart will show how the market views this dual strategy and whether Shell is managing to outperform competitors with more conservative approaches.

Annual dynamics of market capitalization of broad market stocks, index - GURU.Markets
Shell, as one of the world's largest energy companies, is entirely dependent on oil and gas prices. Its shares are cyclical and often move counter-clockwise, benefiting from inflation and high commodity prices. Shell's performance is a barometer of the global energy market and its impact on the global economy.

Dynamics of market capitalization of the company, segment and the market as a whole for the month
Monthly dynamics of the company's market capitalization Shell plc
Shell's price, like that of other energy giants, follows global oil and gas prices. Monthly fluctuations on the chart reflect volatility in commodity markets, as well as the company's strategic steps toward the transition to low-carbon energy, which is becoming an increasingly important factor for investors.

Monthly dynamics of market capitalization of the market segment - Oil and gas exploration
This shows the dynamics of the oil and gas sector, which is entirely dependent on global energy prices. For Shell, one of the largest players, this reflects global demand and its own strategy for transitioning to green energy, against the backdrop of general industry cycles.

Monthly dynamics of market capitalization of broad market stocks, index - GURU.Markets
This shows the dynamics of the global market. For Shell, as for the entire energy sector, this was a backdrop that often moved out of phase. Its earnings were determined by oil and gas prices, not by overall market sentiment, making its shares an inflation hedge.

Dynamics of market capitalization of the company, segment and the market as a whole for the week
Weekly dynamics of the company's market capitalization Shell plc
Shell plc, one of the world's largest energy companies, sees its weekly stock price closely tied to oil and natural gas prices. Furthermore, it is influenced by news of its strategic moves toward renewable energy, forcing investors to evaluate the balance between its traditional and green businesses on a weekly basis.

Weekly dynamics of market capitalization of the market segment - Oil and gas exploration
Shell, like the entire oil and gas sector, sees its weekly performance follow energy prices. However, investors also compare its energy transition strategy with its competitors. The chart helps understand whether the market rewards Shell's decarbonization efforts with a higher valuation than the industry average.

Weekly dynamics of market capitalization of stocks of the broad market, index - GURU.Markets
Shell, as one of the world's major oil and gas companies, is subject to the energy price cycle. Its shares can move counter-clockwise from the market, which is suffering from high inflation caused by high oil prices. The chart shows how often Shell acts as an anti-market, defensive instrument.

Market capitalization of the company, segment and market as a whole
SHEL - Market capitalization of the company Shell plc
Shell's market capitalization, like that of other energy majors, moves in tandem with oil and gas prices. The chart below shows how investors evaluate the balance between its traditional fossil fuel business and its investments in renewable energy. Its high valuation reflects its ability to generate cash but also reflects the risks of the energy transition.

SHEL - Share of the company's market capitalization Shell plc within the market segment - Oil and gas exploration
Shell is a global energy major, whose sector share reflects its global reach in oil and gas production and growing investment in renewable energy. The company's market capitalization reflects its scale and strategic shift toward cleaner energy sources.

Market capitalization of the market segment - Oil and gas exploration
The chart below shows the combined market capitalization of global energy giants. Shell is a leader in this sector, actively investing in the transition to low-carbon energy. Market dynamics reflect not only oil prices but also this complex transformation, where Shell is trying to find a balance between traditional and green businesses.

Market capitalization of all companies included in a broad market index - GURU.Markets
Shell is a global energy company whose value has been synonymous with oil and gas for decades. Its market capitalization reflects the world's current dependence on fossil fuels. The chart below allows you to assess the place of traditional energy in the overall global market structure.

Book value capitalization of the company, segment and market as a whole
SHEL - Book value capitalization of the company Shell plc
Shell's book value represents a global portfolio of real assets: from offshore oil and gas platforms and LNG plants to a network of gas stations and growing investments in renewable energy. The chart is a financial mirror of the energy market, reflecting both investments in production and the company's strategic pivot toward cleaner energy sources.

SHEL - Share of the company's book capitalization Shell plc within the market segment - Oil and gas exploration
Disney's magic is built on a very real and expensive infrastructure. The chart shows the company's share of entertainment industry assets: massive theme parks, cruise ships, film studios, and television channels. This is the tangible world in which the company brings its fairy tales to life and earns billions.

Market segment balance sheet capitalization - Oil and gas exploration
Energy is one of the most capital-intensive industries, as the chart illustrates. Shell is a global titan whose business is built on owning and operating gigantic physical assets: from offshore platforms and LNG plants to a network of gas stations. It's a game of survival for heavyweights.

Book value of all companies included in the broad market index - GURU.Markets
Shell is a global energy major whose power is measured by its physical assets. Its book value includes offshore drilling platforms, the world's largest LNG plants, oil refineries, and a network of gas stations spanning the globe.

The ratio of market capitalization to book capitalization of a company, segment, and the market as a whole
Market capitalization to book capitalization ratio - Shell plc
Shell, like other oil and gas giants, is valued primarily by its tangible assets—reserves and infrastructure. However, the premium (or discount) to these assets reflects investors' faith in the company's ability to successfully transition to renewable energy.

Market to book capitalization ratio in a market segment - Oil and gas exploration
Shell is one of the world's largest energy companies, currently in the process of transforming itself into a renewable energy company. Its valuation is a balance between its profitable oil and gas business and investments in the future. This chart shows how the market evaluates this complex strategy, comparing its market capitalization to its massive traditional asset base.

Market to book capitalization ratio for the market as a whole
Shell is one of the world's largest oil and gas companies, actively investing in the transition to renewable energy. This chart shows the average market valuation. Against this backdrop, Shell's valuation reflects the balance between the profitability of its traditional business and the uncertainty associated with the long-term energy transition.

Debts of the company, segment and market as a whole
SHEL - Company debts Shell plc
For Shell, one of the world's largest oil and gas companies, debt is a tool for managing long-term investment cycles and the transition to low-carbon energy. The company uses debt to finance both traditional projects and new ventures. This chart reflects its efforts to balance current profitability with future transformation.

Market segment debts - Oil and gas exploration
Shell is one of the world's largest oil and gas companies, whose business requires massive investments in exploration and production. At the same time, the company is actively investing in renewable energy. Its debt burden reflects the balance between these capital-intensive areas and is vulnerable to volatile energy prices. This chart illustrates the giant's financial strategy in the era of energy transition.

Market debt in general
Shell is one of the world's largest oil and gas companies, and it is also actively investing in renewable energy. This transition requires significant capital investment and prudent financial management. This chart reflects Shell's overall debt situation, allowing us to assess how Shell balances investments in the future with maintaining financial stability.

Debt to book value of the company, segment and market as a whole
The company's debt to book capitalization ratio Shell plc
Shell is one of the world's largest oil and gas companies, actively investing in the transition to renewable energy. This chart shows how the company is using debt to finance this costly transformation while simultaneously maintaining its traditional business operations. Debt management is key to its future.

Market segment debt to market segment book capitalization - Oil and gas exploration
Shell is one of the world's largest oil and gas companies, actively investing in the transition to renewable energy. This dual strategy requires significant capital. This chart shows how the company balances its financial obligations relative to the energy sector as a whole, reflecting its complex energy transition journey.

Debt to book value of all companies in the market
Shell, like other energy majors, operates in a capital-intensive industry and is investing in a costly energy transition. This chart places its financial structure in the broader economic context. It shows that its high debt level is industry norm but significantly higher than the overall market average.

P/E of the company, segment and market as a whole
P/E - Shell plc
The chart for Shell, one of the global energy majors, shows the company's valuation in a time of change. Its P/E ratio depends not only on current oil and gas prices but also on the degree of investor confidence in the company's strategy to transition to low-carbon energy sources and manage its traditional assets.

P/E of the market segment - Oil and gas exploration
Shell plc is one of the world's largest oil and gas companies, actively investing in the transition to renewable energy and LNG. The company faces the challenge of energy transition. This chart shows the average valuation for the energy sector, helping investors understand how the market views Shell's strategy compared to its competitors.

P/E of the market as a whole
Shell plc is one of the world's largest oil and gas companies, actively investing in the transition to renewable energy. Its valuation is a balance between current fossil fuel revenues and investor confidence in the energy transition. General economic sentiment, visible on the chart, influences oil demand, but Shell's long-term story is written in the ESG environment.

Future P/E of the company, segment and market as a whole
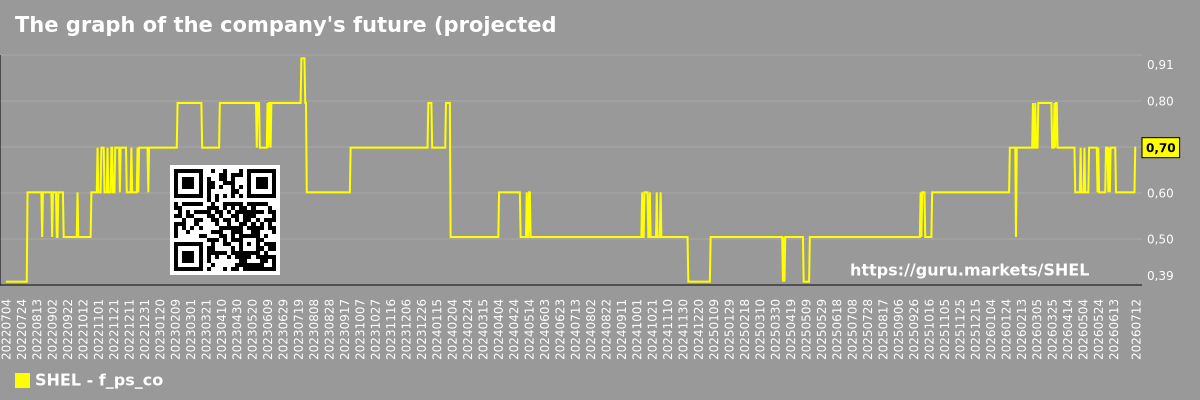
Future (projected) P/E of the company Shell plc
Shell plc is a global energy major undergoing a transformation toward cleaner energy sources. This chart reflects a complex balance of expectations: revenues from conventional oil and gas, on the one hand, and investments in renewable energy, on the other. The company's valuation depends on commodity price forecasts and market confidence in the success of its energy transition.
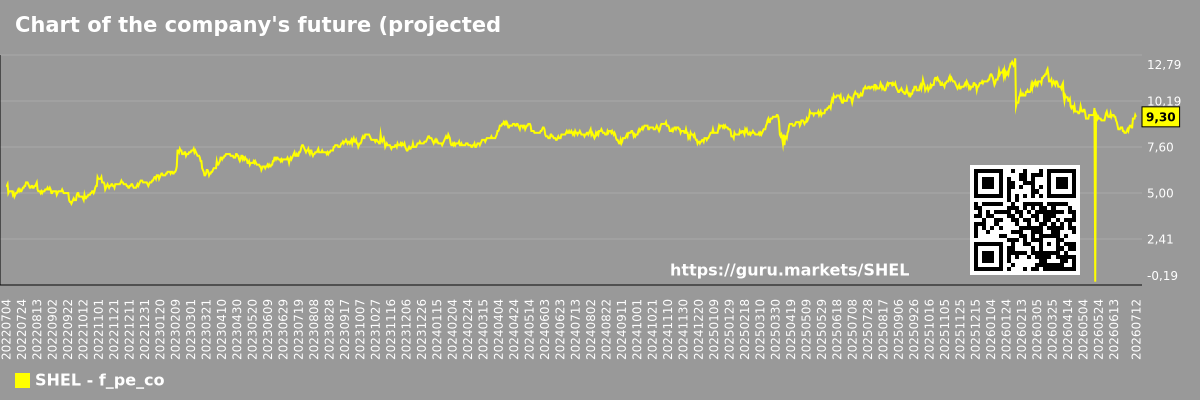%20P%2FE%20Shell%20plc&width=1200&height=400&colorIndex=35&v=mrzxn69z.oxn-6sfdm2o&start=20220704&end=20260702&filename=GURU_Markets_-_Chart-of-the-companys-future-projected-PE-Shell-plc "Chart of the company's future (projected) P/E Shell plc")
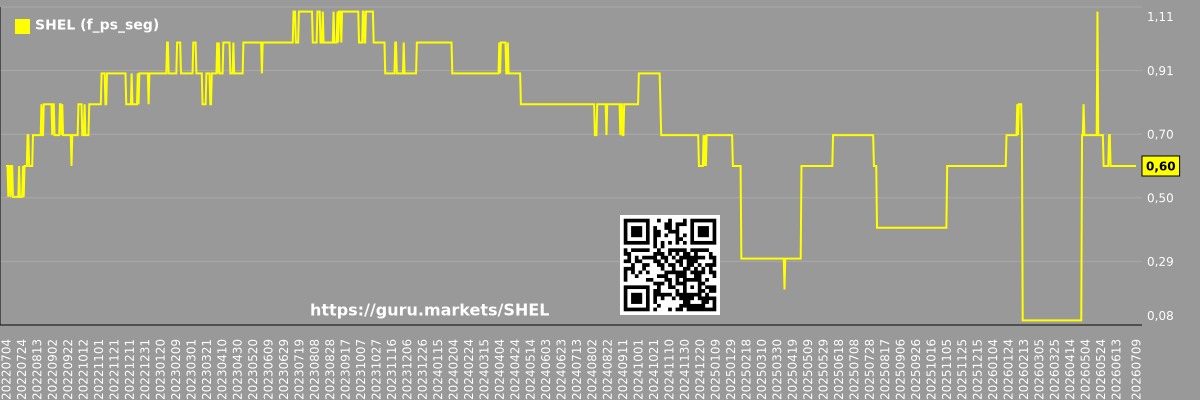
Future (projected) P/E of the market segment - Oil and gas exploration
Shell is one of the world's largest oil and gas companies, and it is also actively investing in renewable energy and LNG as it strives to adapt to the energy transition. This chart reflects the market's view on this dual strategy. Comparing Shell's profit forecasts with the sector reveals how investors view its chances of future success.
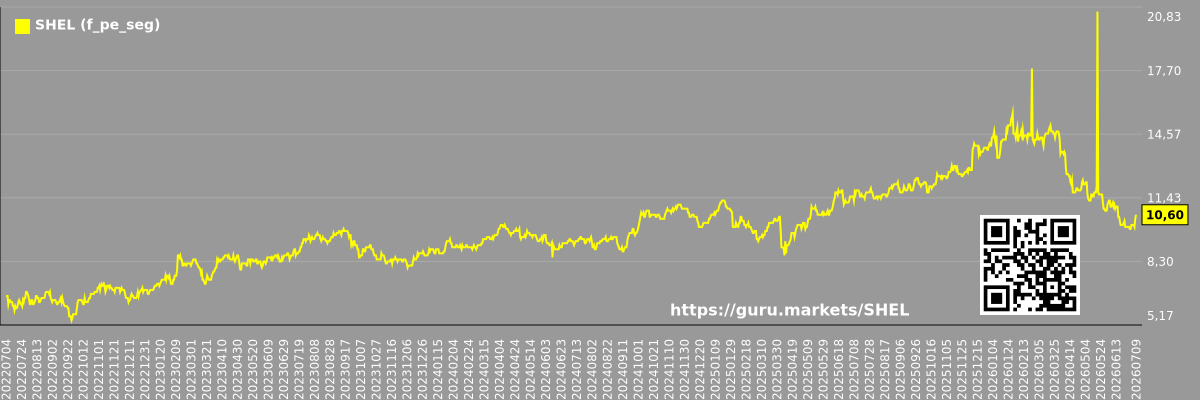%20P%2FE%20graph%20of%20the%20market%20segment%20-%20Oil%20and%20gas%20exploration&width=1200&height=400&colorIndex=36&v=mrzxn69z.oxn-6sfdm2o&start=20220704&end=20260702&filename=GURU_Markets_-_Future-projected-PE-graph-of-the-market-segment-Oil-and-gas-exploration "Future (projected) P/E graph of the market segment - Oil and gas exploration")
Future (projected) P/E of the market as a whole
Shell is one of the world's largest oil and gas companies, and it also actively invests in renewable energy. Its financial performance is dependent on energy prices. This chart of overall market valuations provides insight into investor sentiment toward traditional energy amid the global energy transition and macroeconomic expectations.
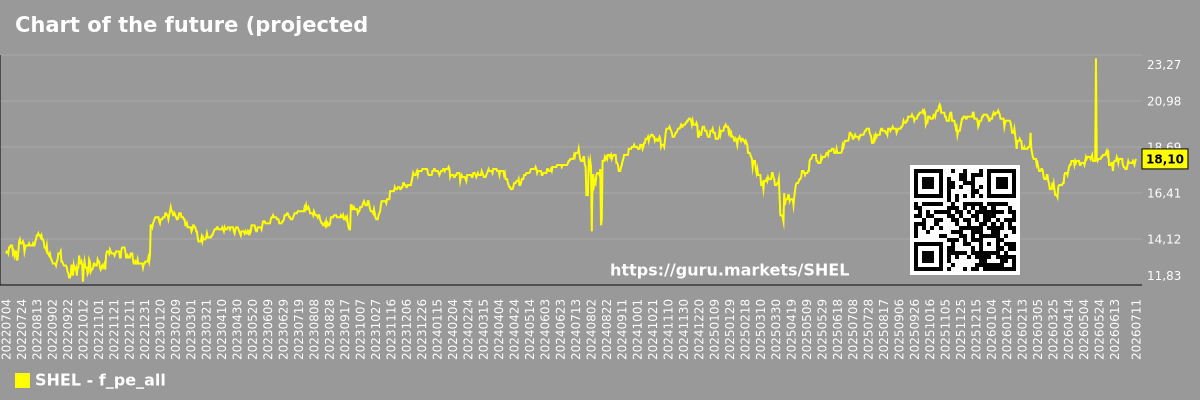%20P%2FE%20of%20the%20market%20as%20a%20whole&width=1200&height=400&colorIndex=37&v=mrzxn69z.oxn-6sfdm2o&start=20220704&end=20260702&filename=GURU_Markets_-_Chart-of-the-future-projected-PE-of-the-market-as-a-whole "Chart of the future (projected) P/E of the market as a whole")
Profit of the company, segment and market as a whole
Company profit Shell plc
Shell plc is a global energy company whose profits depend on oil and natural gas prices, as well as the profitability of refining and petroleum product sales. This chart illustrates the cyclical nature of the energy sector and shows how the company is adapting to the transition to renewable energy sources by balancing old and new businesses.

Profit of companies in the market segment - Oil and gas exploration
Shell plc is one of the world's leading energy companies, actively transforming its business by investing in renewable energy alongside traditional oil and gas production. Its profitability remains highly dependent on energy prices, but its strategy reflects a long-term industry-wide shift toward cleaner energy.

Overall market profit
Shell is one of the world's leading oil and gas companies, also actively investing in renewable energy. Its profits are directly dependent on energy prices and demand, making the company sensitive to global economic cycles. When industry and transportation operate at full capacity, Shell's revenues grow, reflecting the overall health of the economy.

Future (predicted) profit of the company, segment and market as a whole
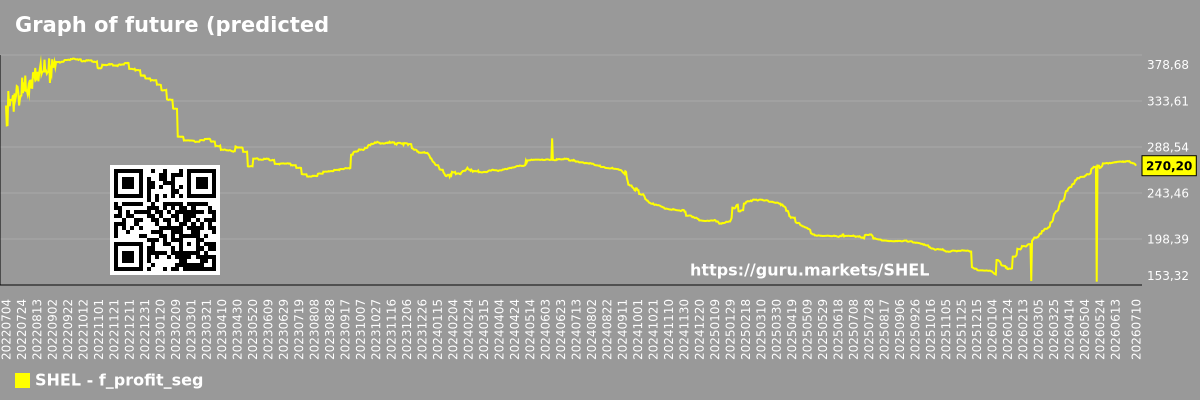
Future (projected) profit of the company Shell plc
Shell is one of the world's largest oil and gas companies, actively investing in the transition to low-carbon energy. This chart reflects analyst expectations, which balance the profitability of traditional oil and gas businesses, dependent on commodity prices, with long-term investments in renewable energy sources.
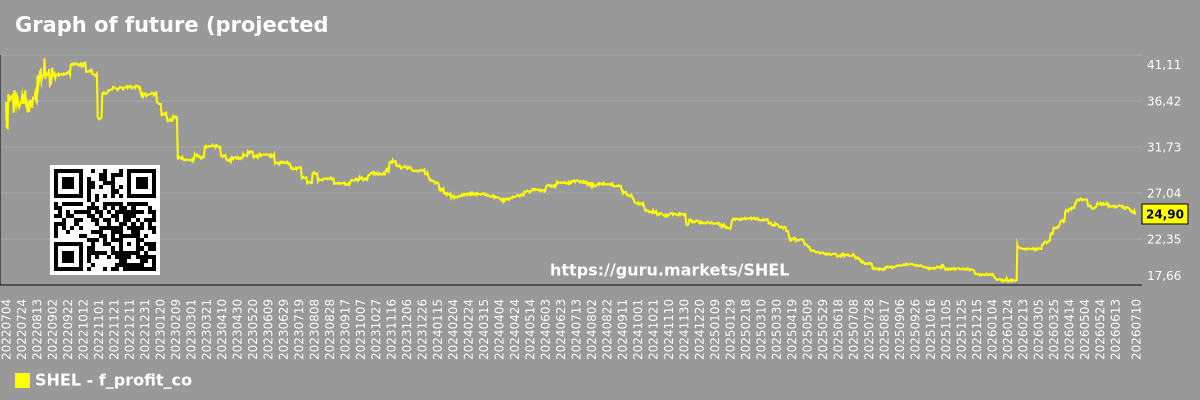%20profit%20of%20the%20company%20Shell%20plc&width=1200&height=400&colorIndex=41&v=mrzxn69z.oxn-6sfdm2o&start=20220704&end=20260702&filename=GURU_Markets_-_Graph-of-future-projected-profit-of-the-company-Shell-plc "Graph of future (projected) profit of the company Shell plc")
Future (predicted) profit of companies in the market segment - Oil and gas exploration
Shell plc is a leading global energy company, actively investing in the transition from fossil fuels to renewable energy sources. The dynamics in this chart reflect the profitability forecasts for the entire energy sector. This provides context for assessing the success of Shell's transformation strategy against overall market expectations.
%20profits%20of%20companies%20in%20a%20market%20segment%20-%20Oil%20and%20gas%20exploration&width=1200&height=400&colorIndex=42&v=mrzxn69z.oxn-6sfdm2o&start=20220704&end=20260702&filename=GURU_Markets_-_Graph-of-future-predicted-profits-of-companies-in-a-market-segment-Oil-and-gas-exploration "Graph of future (predicted) profits of companies in a market segment - Oil and gas exploration")
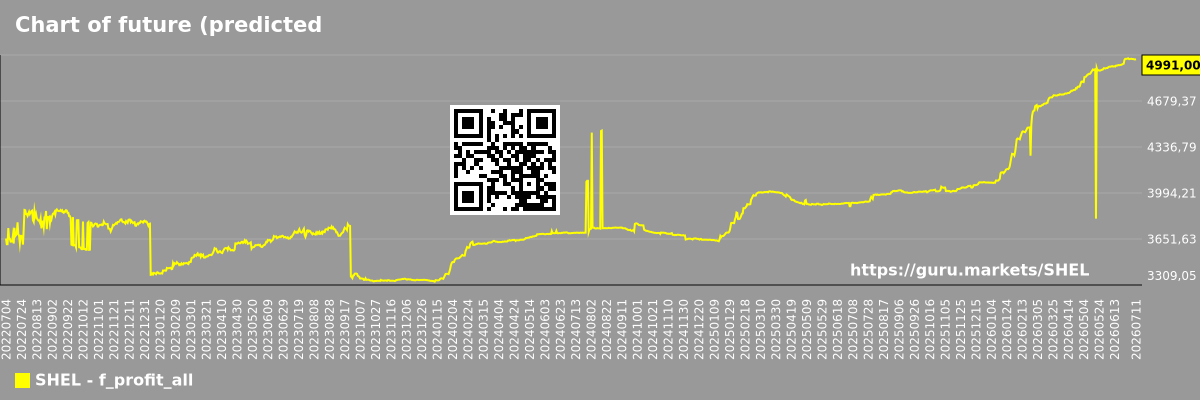
Future (predicted) profit of the market as a whole
This chart shows expectations for one of the global energy giants. Shell's profit forecast, like that of other oil and gas companies, is highly dependent on global energy prices. The dynamics also reflect investor expectations regarding the success of the company's strategy to gradually transition to low-carbon energy sources and manage costs.
%20profits%20of%20the%20market%20as%20a%20whole&width=1200&height=400&colorIndex=43&v=mrzxn69z.oxn-6sfdm2o&start=20220704&end=20260702&filename=GURU_Markets_-_Chart-of-future-predicted-profits-of-the-market-as-a-whole "Chart of future (predicted) profits of the market as a whole")
P/S of the company, segment and market as a whole
P/S - Shell plc
Shell is one of the world's largest energy companies, actively investing in the transition to low-carbon energy sources. This chart shows how the market values its traditional oil and gas revenues alongside its future investments. The multiple reflects the balance between current profitability and its energy transition strategy.

P/S market segment - Oil and gas exploration
Shell is one of the world's largest oil and gas companies, also actively investing in renewable energy and liquefied natural gas (LNG) production. The chart shows the sector's average revenue estimate. This helps assess how the market perceives Shell's energy transition strategy compared to its competitors.

P/S of the market as a whole
Shell is one of the world's largest oil and gas companies, actively investing in the transition to renewable energy. Its revenue is a balance between traditional and new sources. This chart, which displays average revenue estimates for Shell, helps investors understand how they view its ability to adapt to the energy future while maintaining profitability.

Future P/S of the company, segment and market as a whole
Future (projected) P/S of the company Shell plc
Shell is one of the world's largest oil and gas companies, also actively investing in renewable energy and LNG (liquefied natural gas). Estimates of its future earnings depend not only on oil prices but also on the success of its energy transition. This chart shows how investors balance expectations for the company's traditional and green businesses.
%20P%2FS%20Shell%20plc&width=1200&height=400&colorIndex=47&v=mrzxn69z.oxn-6sfdm2o&start=20220704&end=20260702&filename=GURU_Markets_-_The-graph-of-the-companys-future-projected-PS-Shell-plc "The graph of the company's future (projected) P/S Shell plc")
Future (projected) P/S of the market segment - Oil and gas exploration
Shell is one of the world's largest oil and gas companies, and it's also actively investing in renewable energy. This chart shows how investors view its energy transition strategy. Do they believe Shell can successfully transform itself into the energy company of the future, or is its valuation still determined by oil and gas prices?
%20P%2FS%20market%20segment%20graph%20-%20Oil%20and%20gas%20exploration&width=1200&height=400&colorIndex=48&v=mrzxn69z.oxn-6sfdm2o&start=20220704&end=20260702&filename=GURU_Markets_-_Future-projected-PS-market-segment-graph-Oil-and-gas-exploration "Future (projected) P/S market segment graph - Oil and gas exploration")
Future (projected) P/S of the market as a whole
Shell is one of the world's largest oil and gas companies, which also actively invests in renewable energy. Its revenues depend on energy prices and global demand. Shell's results reflect the state of the global economy and the energy transition, influencing overall sentiment and expectations, as illustrated by this chart.
%20P%2FS%20of%20the%20market%20as%20a%20whole&width=1200&height=400&colorIndex=49&v=mrzxn69z.oxn-6sfdm2o&start=20220704&end=20260702&filename=GURU_Markets_-_Chart-of-the-future-projected-PS-of-the-market-as-a-whole "Chart of the future (projected) P/S of the market as a whole")
Sales of the company, segment and market as a whole
Company sales Shell plc
Shell is one of the largest vertically integrated oil and gas companies in the world. Its business spans all stages, from exploration and production to refining and fuel sales at gas stations. This chart shows how global energy prices and demand for petroleum products affect the energy giant's financial performance.

Sales of companies in the market segment - Oil and gas exploration
Shell is one of the world's largest oil and gas companies, actively investing in the transition to low-carbon energy, including LNG and renewables. Its strategy is a balance between traditional and new energy businesses. This chart shows total energy sector sales, reflecting the global energy transition in which Shell is trying to find its place.

Overall market sales
Shell is one of the world's largest oil and gas companies, also actively investing in renewable energy. Its operations fuel the global economy. This chart, which reflects global economic activity, is a key factor for Shell. Growth in GDP and industrial production directly leads to increased demand for energy.

Future sales volume of the company, segment and market as a whole
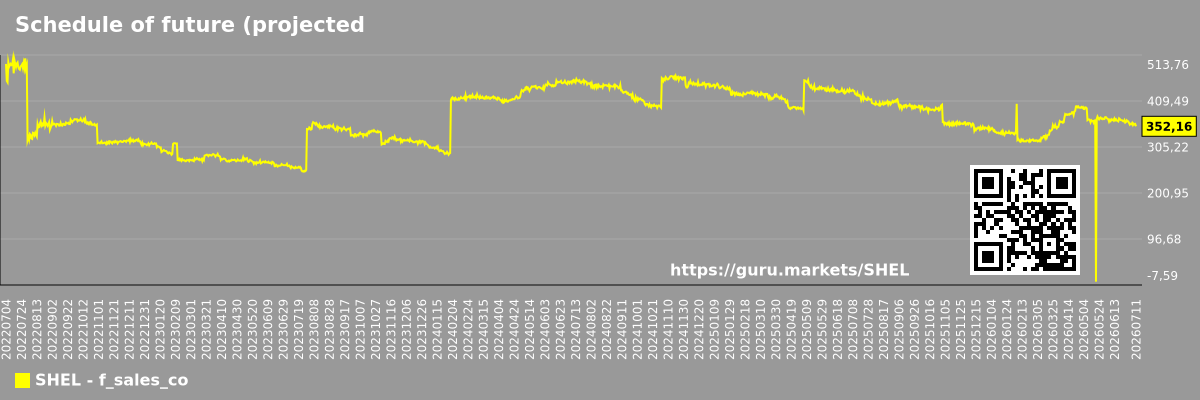
Future (projected) sales of the company Shell plc
Shell is one of the world's largest oil and gas companies, and is also actively investing in renewable energy. Its future revenues remain highly dependent on oil and gas prices, but also on the success of its energy transition. This chart represents analyst forecasts, taking into account both energy market volatility and the company's long-term strategy.
%20sales%20of%20the%20company%20Shell%20plc&width=1200&height=400&colorIndex=53&v=mrzxn69z.oxn-6sfdm2o&start=20220704&end=20260702&filename=GURU_Markets_-_Schedule-of-future-projected-sales-of-the-company-Shell-plc "Schedule of future (projected) sales of the company Shell plc")
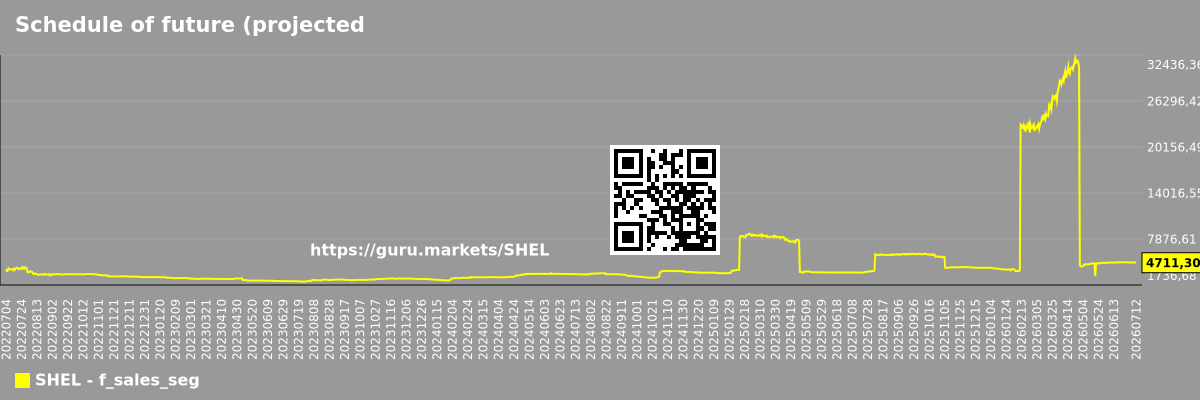
Future (projected) sales of companies in the market segment - Oil and gas exploration
Shell plc is a global energy company engaged in the exploration, production, refining, and marketing of oil and natural gas. This chart shows the total revenue forecast for the entire oil and gas industry. It reflects analyst expectations for energy prices and demand, which are fundamental factors in Shell's financial performance.
%20sales%20of%20companies%20in%20the%20market%20segment%20-%20Oil%20and%20gas%20exploration&width=1200&height=400&colorIndex=54&v=mrzxn69z.oxn-6sfdm2o&start=20220704&end=20260702&filename=GURU_Markets_-_Schedule-of-future-projected-sales-of-companies-in-the-market-segment-Oil-and-gas-exploration "Schedule of future (projected) sales of companies in the market segment - Oil and gas exploration")
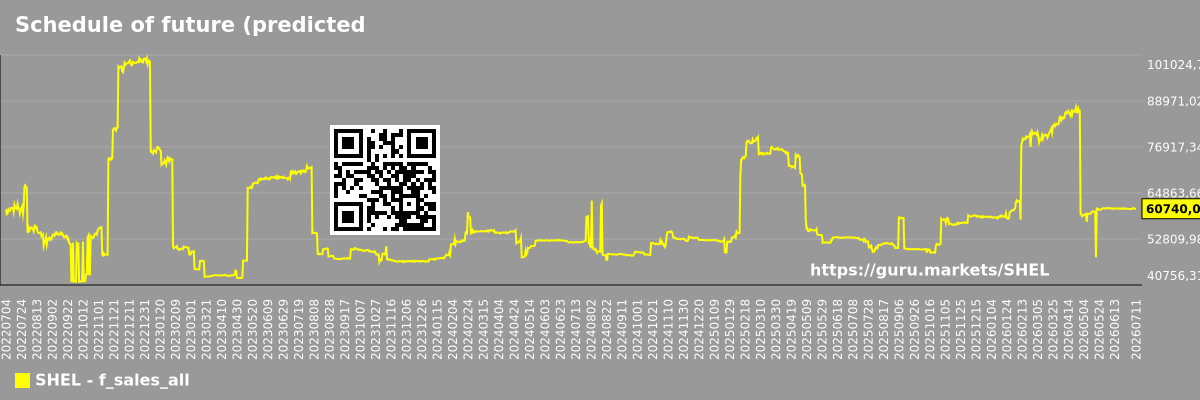
Future (projected) sales of the market as a whole
Shell is one of the world's largest oil and gas companies. Its revenues are directly dependent on energy prices, which in turn are determined by the balance of global supply and demand. This chart, which forecasts global economic activity, is a key indicator of future oil and gas demand. Growth in industrial production and transportation directly increases energy consumption.
%20sales%20of%20the%20market%20as%20a%20whole&width=1200&height=400&colorIndex=55&v=mrzxn69z.oxn-6sfdm2o&start=20220704&end=20260702&filename=GURU_Markets_-_Schedule-of-future-predicted-sales-of-the-market-as-a-whole "Schedule of future (predicted) sales of the market as a whole")
Marginality of the company, segment and market as a whole
Company marginality Shell plc
Shell plc is one of the world's leading energy companies, actively transforming its business towards renewable energy sources. This chart demonstrates how the company's financial results are dependent on oil and gas prices, while also reflecting its efforts to invest in less profitable but promising "green" projects, which creates an internal conflict.

Market segment marginality - Oil and gas exploration
Shell plc is one of the world's largest energy companies, actively transforming its business by investing in natural gas and renewable energy alongside traditional oil. This metric reflects how energy portfolio diversification and cost management in the core business impact overall profitability amid the energy transition.

Market marginality as a whole
Shell is one of the world's largest oil and gas companies, actively investing in the transition to renewable energy. This chart illustrates average profitability. It highlights the challenge facing the entire industry: how to maintain profitability in traditional business while simultaneously funding a costly and, for now, less profitable green transformation.

Employees in the company, segment and market as a whole
Number of employees in the company Shell plc
Shell is one of the world's largest oil and gas companies, actively investing in the transition to low-carbon energy. This chart shows its global team, working in both traditional production and new areas such as hydrogen and renewable energy. The company's workforce dynamics reflect this complex balance between the old and new energy systems.

Share of the company's employees Shell plc within the market segment - Oil and gas exploration
This indicator demonstrates Shell's scale as a global energy major. Its significant share of employees in the oil and gas sector reflects the global reach of its operations, from exploration and production to refining and marketing. At the same time, this human capital is increasingly involved in the company's transition to low-carbon energy sources.

Number of employees in the market segment - Oil and gas exploration
Shell is one of the world's largest oil and gas companies, also actively investing in renewable energy. Managing global projects, from offshore platforms to LNG plants, requires a team of world-class engineers. This chart reflects the scale of employment in the energy sector, where Shell is undergoing a transformation, changing its personnel requirements.

Number of employees in the market as a whole
Shell is one of the global oil and gas "supermajors," actively investing in the energy transition (LNG, hydrogen, and renewable energy). Shell powers the global economy. This graph, which shows overall employment, is an indicator of energy demand. High employment means operating production and active logistics, which directly impacts prices and demand for the oil and gas Shell produces.

Market capitalization per employee (in thousands of dollars) of the company, segment, and market as a whole
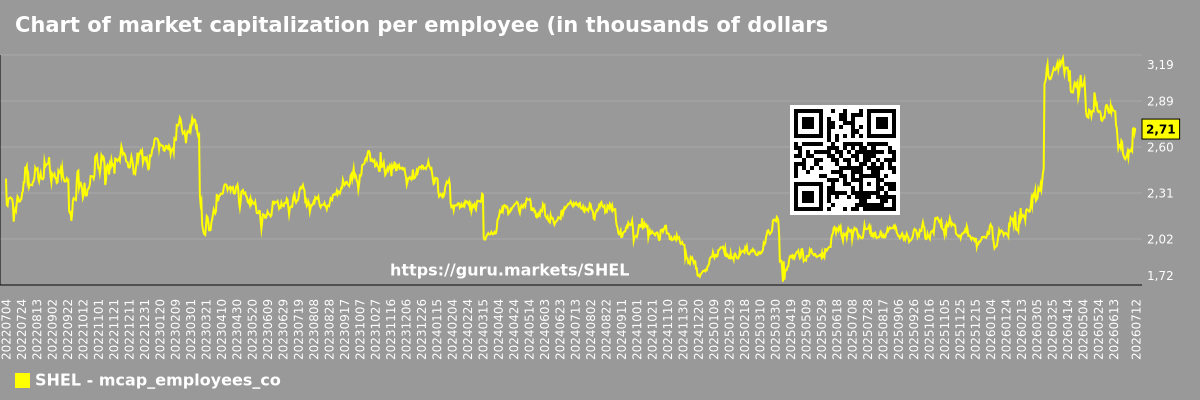
Market capitalization per employee (in thousands of dollars) of the company Shell plc (SHEL)
Shell is one of the world's largest oil and gas companies. Its market capitalization is based on gigantic assets: oil fields, refineries, tankers, and gas stations. This high value reflects the capital intensity of the industry, where the enormous value of assets is attributed to each employee managing this complex system.
%20of%20the%20company%20Shell%20plc%20(SHEL)&width=1200&height=400&colorIndex=63&v=mrzxn69z.oxn-6sfdm2o&start=20220704&end=20260702&filename=GURU_Markets_-_Chart-of-market-capitalization-per-employee-in-thousands-of-dollars-of-the-company-Shell-plc-SHEL "Chart of market capitalization per employee (in thousands of dollars) of the company Shell plc (SHEL)")
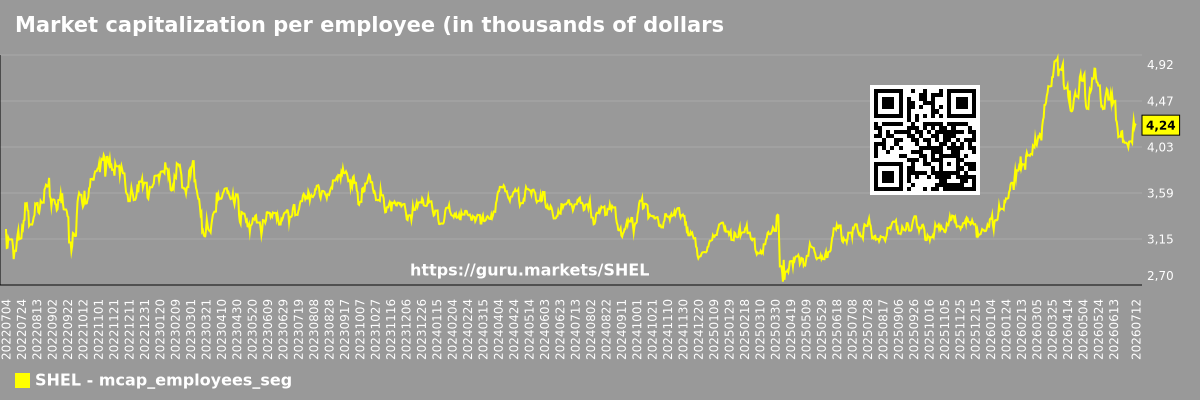
Market capitalization per employee (in thousands of dollars) in the market segment - Oil and gas exploration
Shell is a global energy giant balancing its traditional oil and gas business with an aggressive shift toward LNG and renewable energy. It's a capital-intensive business. This chart shows the market value per employee in the context of this complex energy transition.
%20by%20market%20segment%20-%20Oil%20and%20gas%20exploration&width=1200&height=400&colorIndex=64&v=mrzxn69z.oxn-6sfdm2o&start=20220704&end=20260702&filename=GURU_Markets_-_Market-capitalization-per-employee-in-thousands-of-dollars-by-market-segment-Oil-and-gas-exploration "Market capitalization per employee (in thousands of dollars) by market segment - Oil and gas exploration")
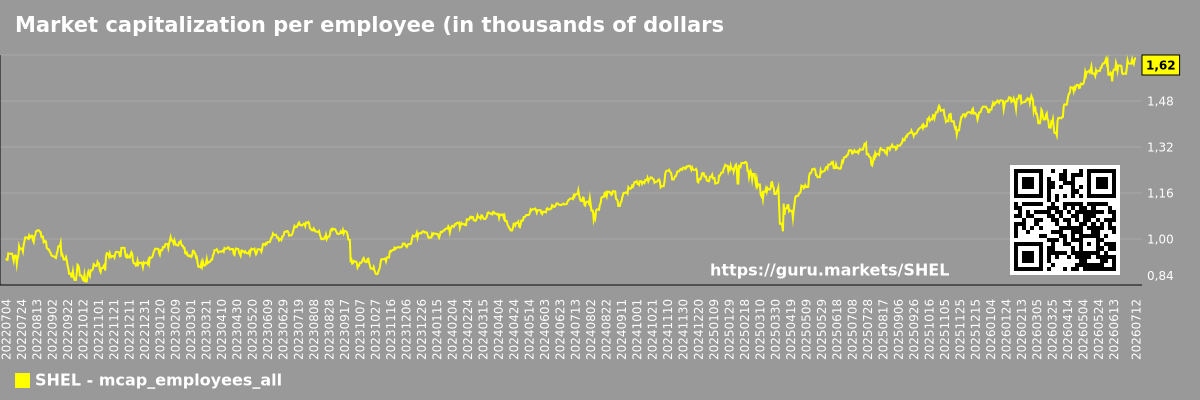
Market capitalization per employee (in thousands of dollars) for the overall market
Shell is one of the world's largest oil and gas companies, actively investing in renewable energy. The market capitalization per employee, visible on this chart, primarily reflects the value of its vast assets—from oil fields to refineries. It is an indicator of capital management efficiency in the energy sector.
%20for%20the%20overall%20market&width=1200&height=400&colorIndex=65&v=mrzxn69z.oxn-6sfdm2o&start=20220704&end=20260702&filename=GURU_Markets_-_Market-capitalization-per-employee-in-thousands-of-dollars-for-the-overall-market "Market capitalization per employee (in thousands of dollars) for the overall market")
Profit per employee (in thousands of dollars) for the company, segment, and market as a whole
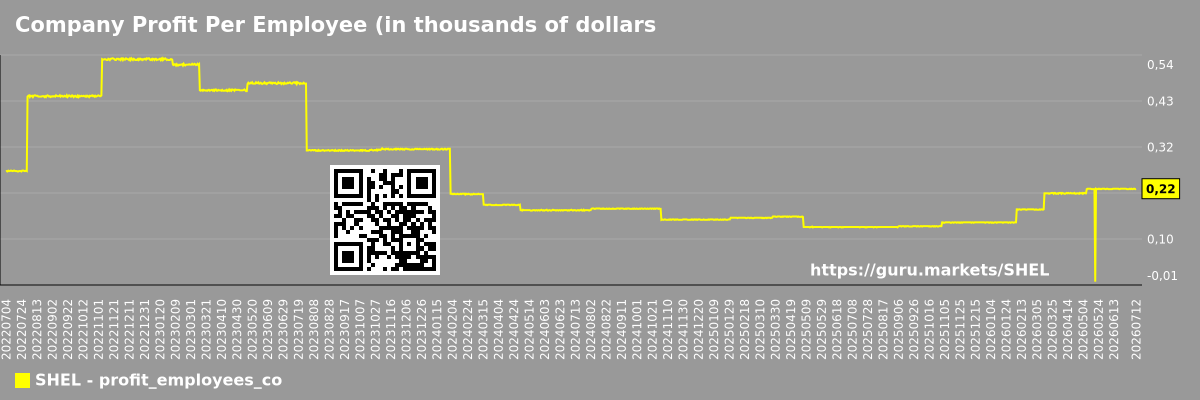
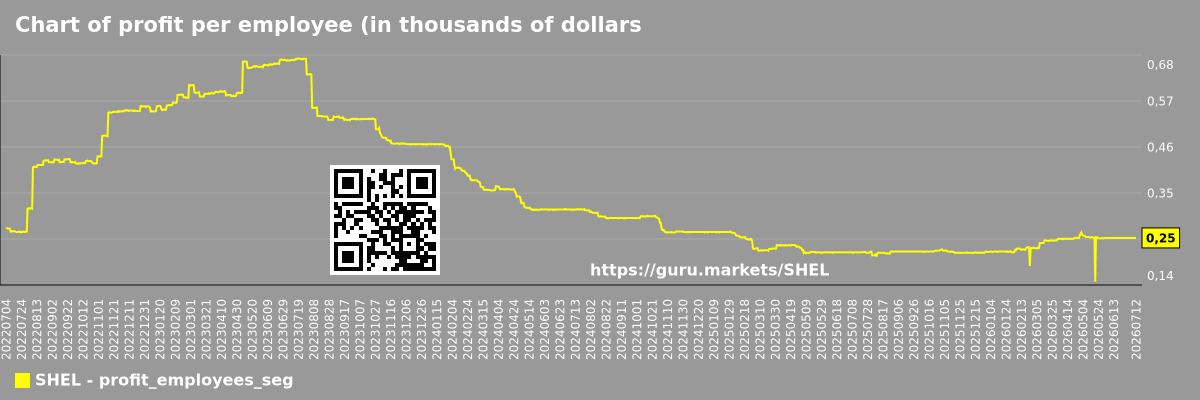
Profit per employee (in thousands of dollars) of the company Shell plc (SHEL)
Shell is a British-Dutch oil and gas major actively investing in the transition to green energy (LNG, hydrogen). This chart, like Exxon's, is highly dependent on energy prices. It shows how effectively the company balances profitable production of "old" oil with investments in future technologies while managing a complex global structure.
%20Chart%20Shell%20plc%20(SHEL)&width=1200&height=400&colorIndex=66&v=mrzxn69z.oxn-6sfdm2o&start=20220704&end=20260702&filename=GURU_Markets_-_Company-Profit-Per-Employee-in-thousands-of-dollars-Chart-Shell-plc-SHEL "Company Profit Per Employee (in thousands of dollars) Chart Shell plc (SHEL)")
Profit per employee (in thousands of dollars) in the market segment - Oil and gas exploration
Shell is a global oil and gas major. This chart shows the industry average for the E&P sector. This indicator is entirely dependent on global commodity prices and is extremely volatile: during years of high oil prices, the average profit per employee (geologist, engineer) is astronomical, while during years of low prices, it plummets.
%20in%20the%20market%20segment%20-%20Oil%20and%20gas%20exploration&width=1200&height=400&colorIndex=67&v=mrzxn69z.oxn-6sfdm2o&start=20220704&end=20260702&filename=GURU_Markets_-_Chart-of-profit-per-employee-in-thousands-of-dollars-in-the-market-segment-Oil-and-gas-exploration "Chart of profit per employee (in thousands of dollars) in the market segment - Oil and gas exploration")
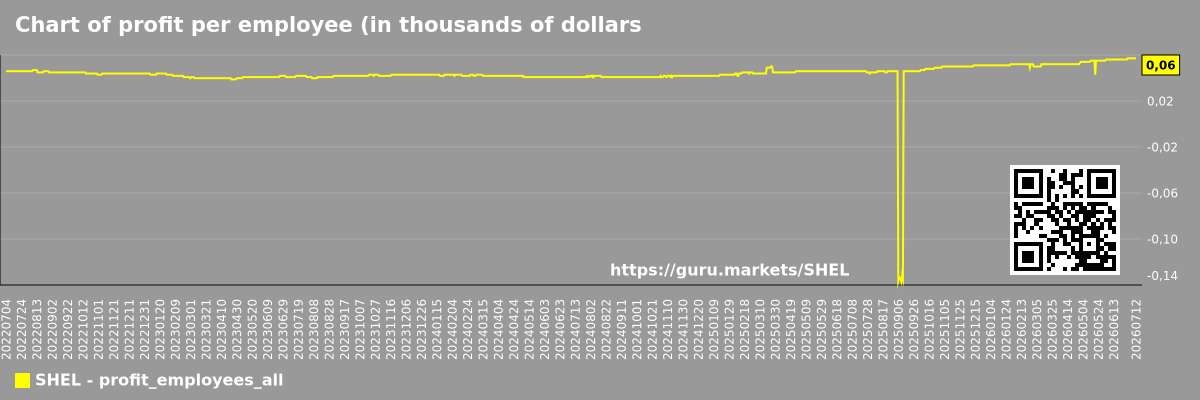
Profit per employee (in thousands of dollars) for the market as a whole
Shell is one of the world's largest oil and gas companies, actively investing in the transition to cleaner energy sources. Its business remains highly dependent on commodity prices, but it also requires the highest levels of engineering expertise. This chart demonstrates how the combination of global scale and sophisticated technology in the energy sector impacts profitability per employee.
%20for%20the%20market%20as%20a%20whole&width=1200&height=400&colorIndex=68&v=mrzxn69z.oxn-6sfdm2o&start=20220704&end=20260702&filename=GURU_Markets_-_Chart-of-profit-per-employee-in-thousands-of-dollars-for-the-market-as-a-whole "Chart of profit per employee (in thousands of dollars) for the market as a whole")
Sales to employees of the company, segment and market as a whole
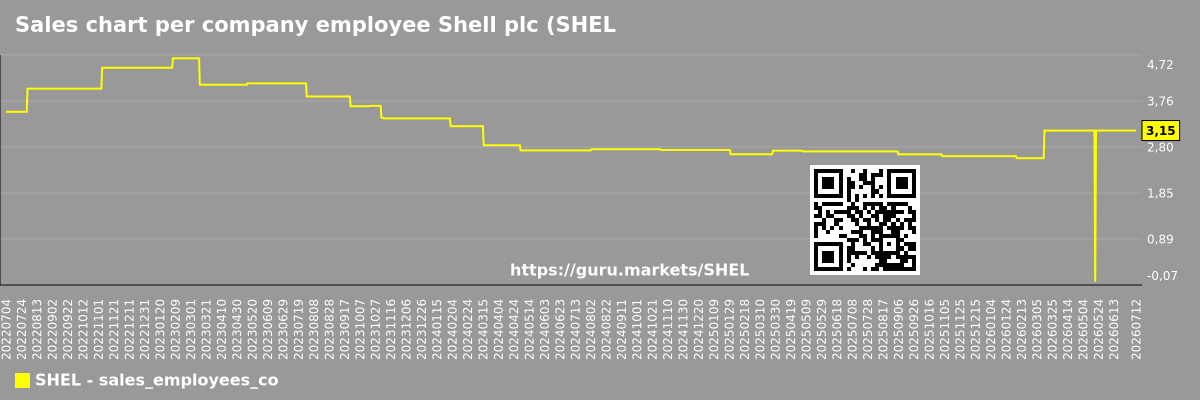
Sales per company employee Shell plc (SHEL)
Shell is one of the world's largest oil and gas companies. This chart, like that of other industry giants, demonstrates the capital intensity of the business. The bulk of revenue is generated not by the number of employees, but by the efficient operation of expensive assets—from drilling platforms to refineries. This indicator is highly correlated with oil and gas prices.
&width=1200&height=400&colorIndex=69&v=mrzxn69z.oxn-6sfdm2o&start=20220704&end=20260702&filename=GURU_Markets_-_Sales-chart-per-company-employee-Shell-plc-SHEL "Sales chart per company employee Shell plc (SHEL)")
Sales per employee in the market segment - Oil and gas exploration
Shell is one of the world's largest oil and gas companies, actively investing in the transition to renewable energy. This chart shows the average revenue per employee in the segment. It allows us to assess how productive Shell's staff is, both in its traditional business and in new energy projects, compared to other major companies.

Sales per employee for the market as a whole
Shell is one of the largest oil and gas "supermajors" (along with Exxon and BP). Their business spans the entire value chain, from exploration to retail, with a growing focus on LNG (liquefied natural gas) and renewable energy. This metric in the oil and gas industry is highly dependent on commodity prices and the performance of their expensive assets (platforms and refineries).

Short shares by company, segment and market as a whole
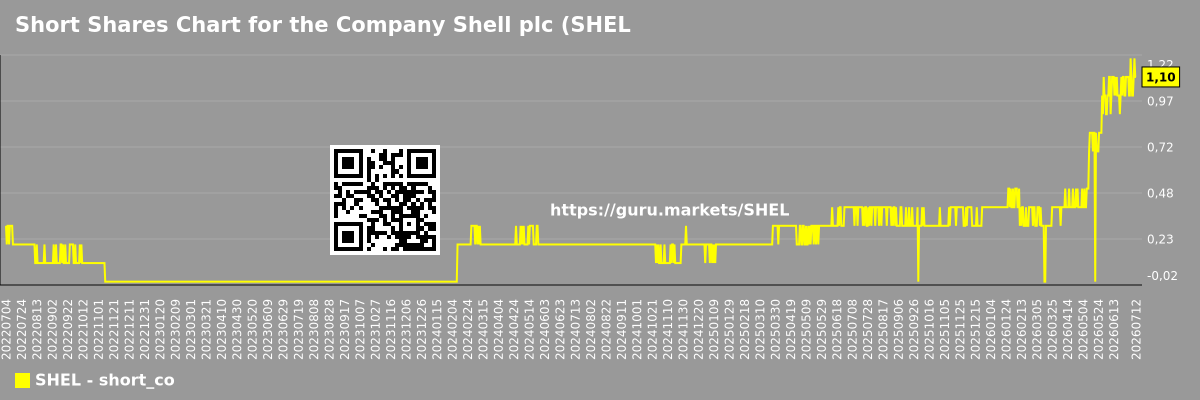
Shares shorted by company Shell plc (SHEL)
Shell is a British-Dutch oil and gas company, one of the world's majors. Like other oil companies, this chart often reflects bets on falling oil and gas prices. Furthermore, bears may doubt the company's energy transition strategy, believing that investments in green energy will not yield the desired returns and will reduce overall profitability.
&width=1200&height=400&colorIndex=72&v=mrzxn69z.oxn-6sfdm2o&start=20220704&end=20260702&filename=GURU_Markets_-_Short-Shares-Chart-for-the-Company-Shell-plc-SHEL "Short Shares Chart for the Company Shell plc (SHEL)")
Shares shorted by market segment - Oil and gas exploration
Shell is one of the world's largest oil and gas companies, actively transforming itself into LNG (liquefied natural gas) and renewable energy. This chart shows the overall sentiment towards the sector. It reflects investors' collective bets on falling energy prices or that the green transition will be too expensive for the entire industry.

Shares shorted by the overall market
Shell is a European oil and gas major that actively invests in LNG and renewable energy. Its revenue depends on energy prices. This chart reflects the general fear of investors. A rise in this indicator signals expectations of a global economic downturn, which will lead to a decline in demand for oil and gas, putting pressure on Shell's business.

RSI 14 indicator for a company, segment, and market as a whole
The company's RSI 14 indicator Shell plc (SHEL)
Shell, one of the world's largest energy majors, is moving toward an energy transition but remains heavily dependent on oil and gas. The dynamics of this indicator are closely linked to energy prices and sentiment around the company's strategy. A level above 70 indicates a price peak, while a level below 30 indicates fear of a recession.
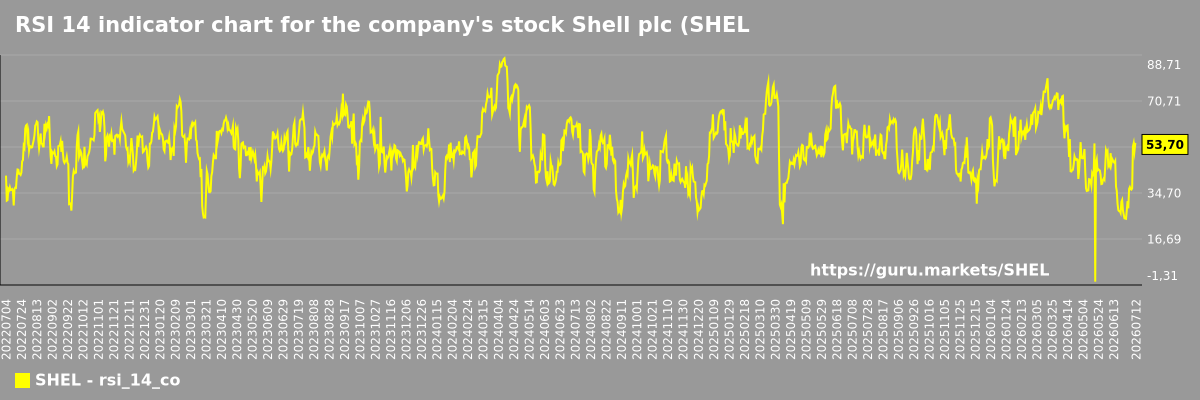&width=1200&height=400&colorIndex=75&v=mrzxn69z.oxn-6sfdm2o&start=20220704&end=20260702&filename=GURU_Markets_-_RSI-14-indicator-chart-for-the-companys-stock-Shell-plc-SHEL "RSI 14 indicator chart for the company's stock Shell plc (SHEL)")
RSI 14 Market Segment - Oil and gas exploration
Shell (SHEL) is a European oil and gas giant that (compared to its American peers) is placing a heavy emphasis on LNG and a gradual green transition. This chart shows the overall momentum in the energy sector. It helps us understand: is SHEL rising in response to overheated oil prices, or is the market appreciating its LNG strategy?

RSI 14 for the overall market
Shell is one of the global oil and gas majors, actively investing in the transition to new energy sources but still heavily dependent on fossil fuels. This chart shows how the overall market "temperature" (euphoria or panic) influences investor appetite for cyclical energy stocks, balancing the old and the new.

Analyst consensus forecast for the company's share price, the segment, and the market as a whole
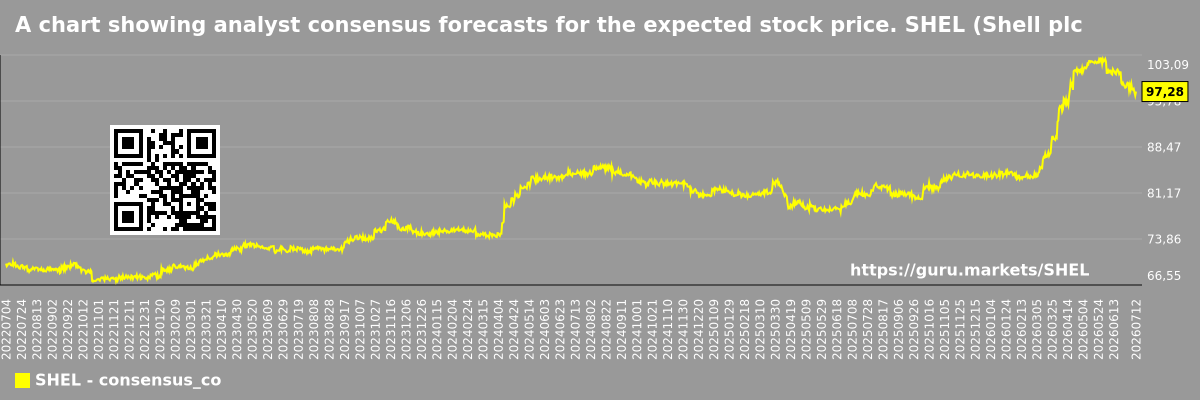
Analyst consensus stock price forecast SHEL (Shell plc)
The Shell consensus forecast is Wall Street's collective view on future oil and gas prices, as well as its leadership in LNG. When forming their target price, analysts evaluate the company's capital allocation discipline (buybacks, dividends) and its "energy transition" strategy. Their forecast is a balance between high current cash flow and long-term risks.
&width=1200&height=400&colorIndex=78&v=mrzxn69z.oxn-6sfdm2o&start=20220704&end=20260702&filename=GURU_Markets_-_A-chart-showing-analyst-consensus-forecasts-for-the-expected-stock-price.-SHEL-Shell-plc "A chart showing analyst consensus forecasts for the expected stock price. SHEL (Shell plc)")
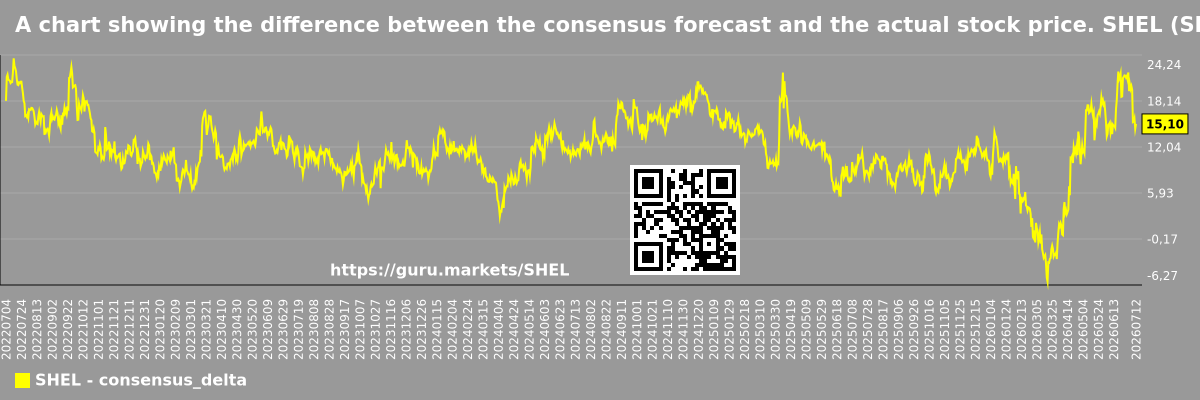
The difference between the consensus estimate and the actual stock price SHEL (Shell plc)
Shell plc is a British-Dutch oil and gas major and one of the world's leading producers of liquefied natural gas (LNG). This chart shows the difference between the consensus forecast and the price. It reflects how analysts assess the company's balance between traditional energy (which generates cash) and investments in the green transition, and whether they see potential in this.
&width=1200&height=400&colorIndex=79&v=mrzxn69z.oxn-6sfdm2o&start=20220704&end=20260702&filename=GURU_Markets_-_A-chart-showing-the-difference-between-the-consensus-forecast-and-the-actual-stock-price.-SHEL-Shell-plc "A chart showing the difference between the consensus forecast and the actual stock price. SHEL (Shell plc)")
Analyst consensus forecast for stock prices by market segment - Oil and gas exploration
Shell is a British-Dutch oil and gas major, one of the world's leaders in liquefied natural gas (LNG) production and renewable energy investment. This chart shows analysts' overall expectations for the entire energy sector. It reflects whether experts believe in long-term high gas and oil prices or expect a decline.

Analysts' consensus forecast for the overall market share price
Shell, like other oil and gas giants, is betting on the health of the global economy. Demand for energy (oil, LNG) is directly dependent on industrial activity. This chart shows the general consensus forecast. If experts expect a recession (a downward trend in the chart), this means a decline in global fuel demand, which puts pressure on oil prices and Shell's earnings.

AKIMA index of the company, segment and market as a whole
AKiMA Company Index Shell plc
Shell is a European oil and gas supermajor with a strong position in the liquefied natural gas (LNG) sector. The company is under pressure to embrace a green transition. This chart reflects a complex balance: current profitability from high oil and gas prices versus market appreciation of its renewable energy investment strategy.

AKIMA Market Segment Index - Oil and gas exploration
Shell is a global energy giant, strong not only in oil production but also a world leader in liquefied natural gas (LNG) production. This comprehensive index evaluates companies. The chart shows the sector average. It helps understand how Shell's focus on LNG and trading distinguishes it from the average oil and gas company.

The AKIM Index for the overall market
Shell is a British-Dutch oil and gas company, one of the world's majors. The company invests heavily not only in production but also in LNG (liquefied natural gas) and renewable energy. This chart, showing the market average, is important for context. It helps assess how Shell, whose revenue depends on volatile energy prices, compares to the overall economic picture, which is influenced by those prices.
