SIFCO Industries, Inc. (SIF) Year-over-year earnings per share growth for the last twelve months

The quarterly earnings per share chart for SIFCO Industries, Inc. (SIF) demonstrates steady demand for massive forged components within the US defense sector, where the metric value stands at -101.00. The business relies on stable government contracts, minimizing the impact of economic crises. Production optimization is achieved through external line maintenance and steel procurement from partners.

Comprehensive metric breakdowns and analytics for SIFCO Industries, Inc. (SIF)
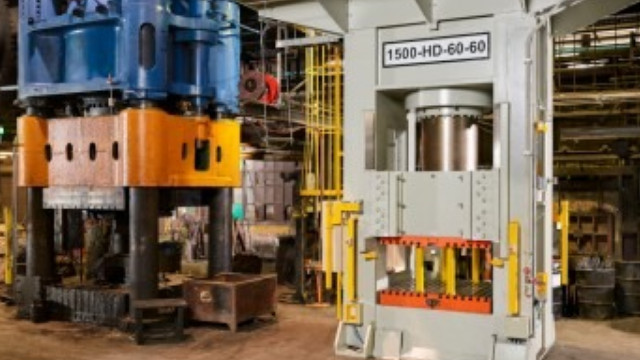
Steady demand for aerospace forgings provides SIFCO Industries, Inc. (SIF) with a regular capital inflow, which is directly reflected in the quarterly earnings per share (EPS) trend. This indicator measures the percentage change in net income per share over a period, allowing investors to assess the business's efficiency in adapting to macroeconomic shifts and liquidity through the lens of real yield growth.
