SIF SIFCO: Net earnings per one share for the last twelve months

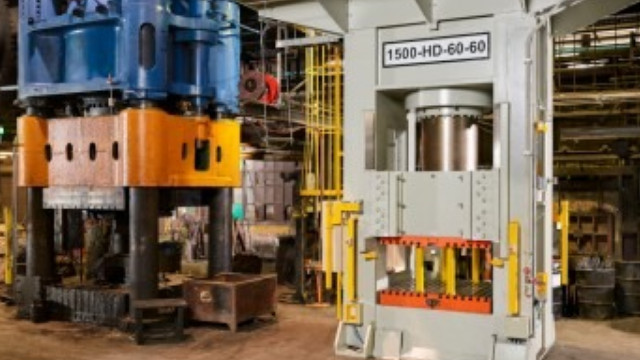
The production of aerospace forged components requires rigorous certification and the possession of unique presses, creating a significant barrier to entry. The price evolution of SIFCO Industries, Inc. (SIF) with the 674.60 indicator confirms the resilience of a business based on long-term US government contracts, which mitigate crisis risks. High capital expenditures for facility equipment allow SIFCO Industries, Inc. (SIF) to effectively maintain its position, avoiding destructive price wars with other players.

SIF (SIFCO Industries): analytical breakdowns and indicator data
Complex US defense certifications create insurmountable barriers to entry for SIFCO Industries, Inc. (SIF), ensuring order stability for titanium components. The EPS YoY TTM growth trajectory reflects earnings per share dynamics over the last twelve months, allowing investors to identify asset overheating through year-over-year comparisons and assess real capital stability excluding hidden debts.
