Smart Sand, Inc. - SND Sales Growth YoY (TTM)

Smart Sand, Inc. (SND) automates proppant production using robotics to reduce manual labor. The year-over-year percentage change in sales volume for the LTM demonstrates revenue dynamics, where 21.20 reflects the most recent value of the metric. The company's revenues rely on activity within the US shale sector, while distribution efficiency is supported by an extensive network of proprietary rail terminals and logistics hubs.

Smart Sand (SND) - metric breakdowns and financial figures
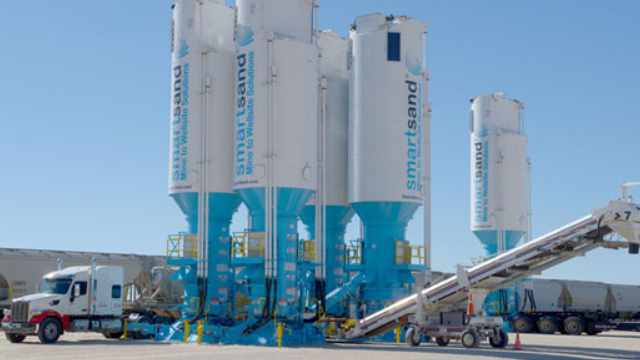
Smart Sand, Inc. (SND) is developing the extraction and logistics of frac sand through its own quarries in Texas and Wisconsin. The 21.20 indicator reflects the percentage change in revenue over the last 12 months relative to the same period last year. This metric allows investors to assess business scaling rates and demand within the oil and gas sector. Stable growth confirms the efficiency of the terminal infrastructure. By analyzing the year-over-year growth in sales volume over the last 12 months, one can determine the company's current market cycle phase.
