SNDX: Syndax Operating Margin
Syndax Pharmaceuticals develops targeted leukemia treatments for oncology centers. This daily price action of the core business margin on the GURU.Markets chart demonstrates business efficiency, where the -61.70 mark records this metric. Patents for unique molecules provide the company with pricing power. The transition to drug commercialization triggers autonomous revenue growth independent of the macroeconomic backdrop.

Syndax Pharmaceuticals (SNDX) - metric breakdowns and financial figures
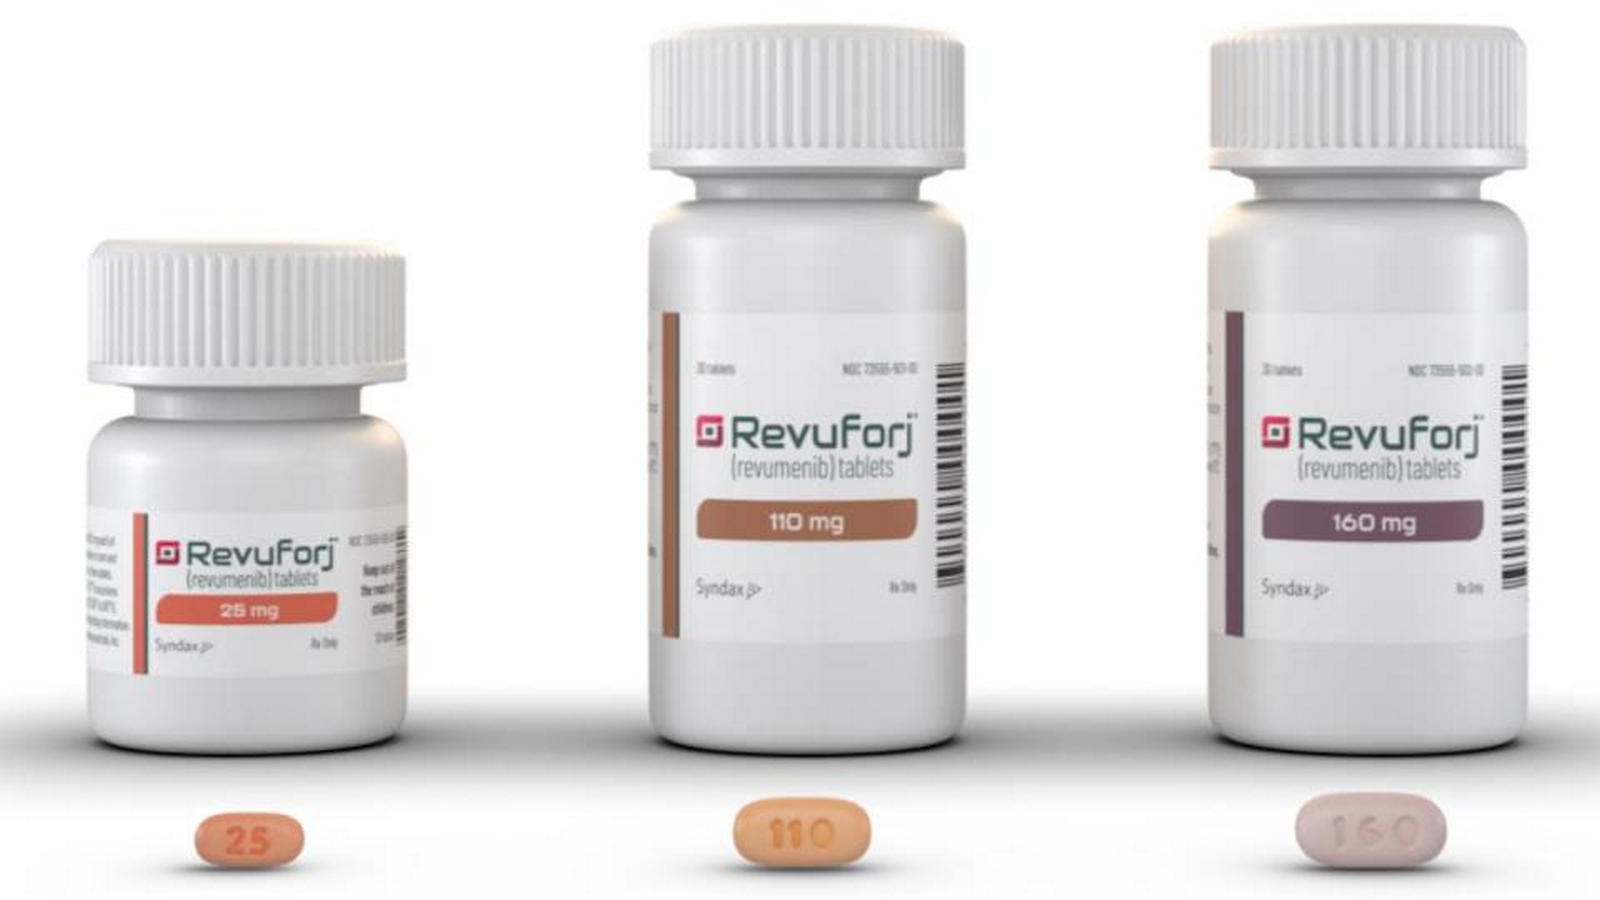
Operating margin measures the efficiency of the core business, excluding the impact of tax policy and the cost of debt. This metric demonstrates the ability of Syndax Pharmaceuticals (SNDX) to convert revenue into operating income. By analyzing operating margins, an investor assesses the profitability of developing revumenib for the therapy of rare leukemias. For Syndax Pharmaceuticals (SNDX), this is a key indicator of R&D cost quality. Steady growth in this metric confirms the fundamental stability of the business model.
