Stereotaxis Inc (STXS) Price to Earnings Ratio

Corporate emblem and logo of Stereotaxis Inc (STXS)

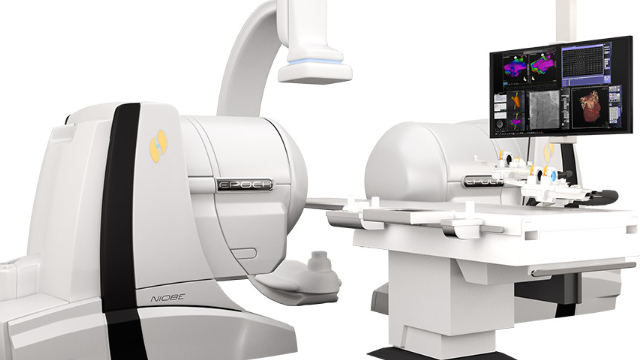
Stereotaxis, Inc. (STXS) develops robotic systems for cardiology, yet slow adoption of expensive systems and competition from traditional treatments create barriers. This chart reflects the asset's value with the -3.90 metric, serving as an indicator of a situation where strong technical potential requires flexible leasing due to clinic budget constraints. Meanwhile, robotic precision reduces waste, which, combined with plant modernization, improves the environmental footprint.

Stereotaxis Corporation (STXS) Price to Earnings Ratio: for the period 07/04/2022 - 11/12/2026
Original product of stereotaxis.com

Fundamental asset screening begins with an assessment of the business's market value relative to its ability to generate income. The P/E ratio of Stereotaxis, Inc. reflects the cost per unit of profit, making it possible to determine whether the shares are overvalued or possess growth potential. The dynamics of this indicator signal the current phase of the technological cycle for Stereotaxis, Inc. Investment attractiveness here depends directly on scaling the implementation of unique robotic magnetic navigation systems across the global network of clinics.

Analysis of competing companies

P/E Multiple bostonscientific.com|Price to Earnings Ratio Edwards Lifesciences Corporation (EW)|Price to Earnings Ratio RMD (ResMed Inc)|P/E Multiple PODD (OmniPod)|Business Payback Period Zimmer Biomet (ZBH)|COO: Price to Earnings Ratio|Market Cap to Net Income ALGN|GMED: P/E Multiple|Market Cap to Earnings TransMedics Organ Care System (TMDX)|ATEC (ATEC Spine) - P/E Multiple|Price to Earnings Multiple AORT (Artivion Corp)|Price to Earnings Ratio ENOV (Enovis Corporation)|IART (integralife.com) - Company Value to Net Income|Price to Earnings Ratio Establishment Labs Holdings Inc. ESTA|BBNX - Price to Earnings Ratio|Iradimed - P/E Multiple|Market Cap to Earnings Embecta Health|TNDM: P/E Multiple|Price to Earnings Multiple AXGN|SIBN (SI-BONE) - P/E Multiple|Orthofix Medical (OFIX) - Business Payback Period|P/E Multiple BVS|Price to Earnings Ratio orthopediatrics.com KIDS|P/E Multiple TMCI (Treace Medical Concepts)|P/E Multiple blade.com SRTA|CARL - Price to Earnings Ratio|RXST: Price to Earnings Ratio|CLPT (clearpointneuro.com) - Price to Earnings Ratio|Neuronetics, Inc - Company Value to Net Income|SGHT (Sight Sciences, Inc.) - P/E Multiple|Market Cap to Earnings orchestrabiomed.com OBIO|Price to Earnings Ratio Anika Therapeutics (ANIK)|InspireMD Inc (NSPR) - Market Cap to Net Income Ratio|Jin Medical - Price to Earnings Ratio|P/E Multiple Vivani Medical Inc VANI|Xtant Medical Inc - P/E Multiple|Business Payback Period n1mtc.com NMTC|modular-medical.com (MODD) - Price to Earnings Ratio|Market Cap to Net Income MYO (Myomo Inc.)|Price to Earnings Ratio Envoy Medical, Inc|Price to Earnings Ratio Vivos Therapeutics Inc (VVOS)|P/E Multiple NVNO|SINT - Market Cap to Earnings|Price to Earnings Ratio Tenon Medical TNON|LFWD: Price to Earnings Multiple|AMIX: Price to Earnings Ratio|INVO Fertility Corp - Market Price to Net Income Ratio|Bone Biologics (BBLG) - Price to Earnings Ratio|AXNX - Business Payback Period|Price to Earnings Ratio BIOL|DYNT (Dynatronics Corp.) - Market Price to Net Income Ratio|P/E Multiple FNA|INVO - Market Cap to Earnings