Treace Medical Concepts Inc (TMCI) Price to Earnings Ratio

Corporate emblem and logo of Treace Medical Concepts Inc (TMCI)

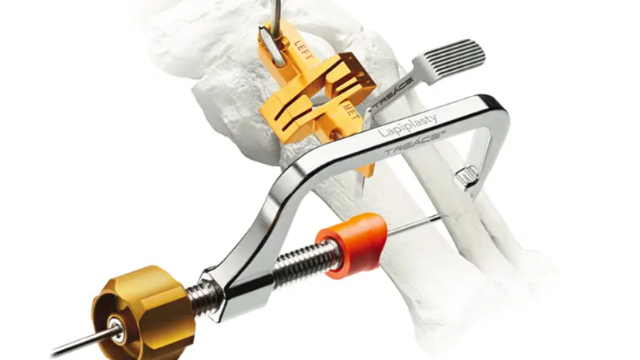
The Treace Medical Concepts (TMCI) price chart illustrates the P/E multiple dynamics, which currently stand at -6.40, correlating directly with the adoption rates of innovative methodologies and insurance reimbursement conditions. The brand is recognized as the benchmark in bunion correction due to its proprietary 3D approach. FDA protection and high loyalty among surgeons who have transitioned to new surgical standards guarantee a steady client flow and the absence of low-cost substitutes.

Treace Corp (TMCI) Price to Earnings Ratio: for the period 07/04/2022 - 11/13/2026
Original product of treace.com

Investors are assessing the potential of Treace Medical Concepts (TMCI) through the lens of the price-to-earnings ratio. This multiple determines the price of a single unit of income, making it possible to identify whether the asset is overvalued relative to its actual profit generation. By analyzing the historical P/E range of Treace Medical Concepts (TMCI), one can understand the extent to which patent protection and proprietary operational protocols convert into sustainable capitalization growth. This helps distinguish the fundamental value of the business from speculative optimism.

Analysis of competing companies

P/E Multiple bostonscientific.com|Price to Earnings Ratio Edwards Lifesciences Corporation (EW)|Price to Earnings Ratio RMD (ResMed Inc)|P/E Multiple PODD (OmniPod)|Business Payback Period Zimmer Biomet (ZBH)|COO: Price to Earnings Ratio|Market Cap to Net Income ALGN|GMED: P/E Multiple|Market Cap to Earnings TransMedics Organ Care System (TMDX)|ATEC (ATEC Spine) - P/E Multiple|Price to Earnings Multiple AORT (Artivion Corp)|Price to Earnings Ratio ENOV (Enovis Corporation)|IART (integralife.com) - Company Value to Net Income|Price to Earnings Ratio Establishment Labs Holdings Inc. ESTA|BBNX - Price to Earnings Ratio|Iradimed - P/E Multiple|Market Cap to Earnings Embecta Health|TNDM: P/E Multiple|Price to Earnings Multiple AXGN|SIBN (SI-BONE) - P/E Multiple|Orthofix Medical (OFIX) - Business Payback Period|P/E Multiple BVS|Price to Earnings Ratio orthopediatrics.com KIDS|P/E Multiple SRTA (Strata Critical Medical Inc)|P/E Multiple carlsmed.com CARL|RXST - Price to Earnings Ratio|CLPT: Price to Earnings Ratio|STXS (Stereotaxis Corp) - Price to Earnings Ratio|Neuronetics, Inc - Company Value to Net Income|SGHT (Sight Sciences, Inc.) - P/E Multiple|Market Cap to Earnings orchestrabiomed.com OBIO|Price to Earnings Ratio Anika Therapeutics (ANIK)|InspireMD Inc (NSPR) - Market Cap to Net Income Ratio|Jin Medical - Price to Earnings Ratio|P/E Multiple Vivani Medical Inc VANI|Xtant Medical Inc - P/E Multiple|Business Payback Period n1mtc.com NMTC|modular-medical.com (MODD) - Price to Earnings Ratio|Market Cap to Net Income MYO (Myomo Inc.)|Price to Earnings Ratio Envoy Medical, Inc|Price to Earnings Ratio Vivos Therapeutics Inc (VVOS)|P/E Multiple NVNO|SINT - Market Cap to Earnings|Price to Earnings Ratio Tenon Medical TNON|LFWD: Price to Earnings Multiple|AMIX: Price to Earnings Ratio|INVO Fertility Corp - Market Price to Net Income Ratio|BBLG (Bone Biologics) - Price to Earnings Ratio|AXNX: Market Price to Net Income Ratio|Price to Earnings Ratio BIOLASE|DYNT: Company Value to Net Income|P/E Multiple FNA|INVO - Market Cap to Earnings