Symbotic Inc. (SYM): Net earnings per share for the last 12 months

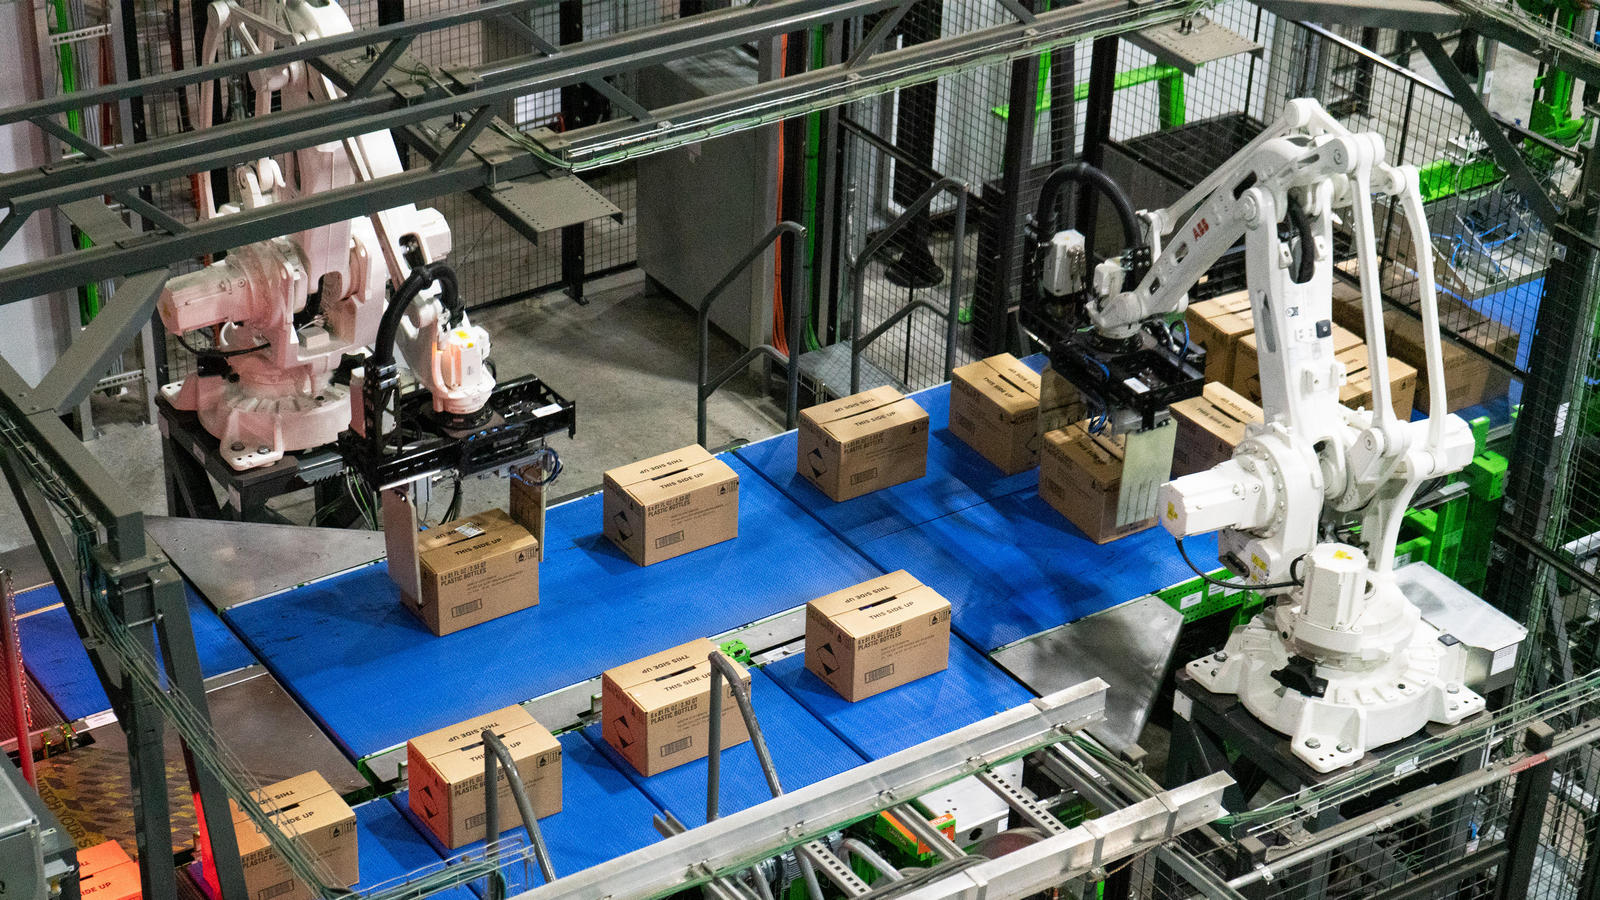
Risks for Symbotic Inc. (SYM) are linked to a heavy reliance on Walmart and the complexity of implementing AI systems. The 12-month rolling earnings per share history visualizes this momentum, where the current value stands at 0.09. The company's robotic ecosystem radically increases warehouse efficiency, while the US reshoring trend ensures stable growth without geopolitical threats.

Analytical breakdowns and data insights for company Symbotic Inc (SYM)
TTM net income per share reflects the actual return on each unit of capital over the year, allowing for an assessment of the business's operational efficiency regardless of the volume of issuance. The trend in TTM net income per share is critical for Symbotic Inc. (SYM), as it confirms the company's ability to scale robot production while switching electronic module suppliers and optimizing logistics chains.
