TS (Tenaris Group) Total Debt to Capital

Tenaris S.A. business relies on hydrocarbon extraction cycles and demand for OCTG pipes. Tracking the debt-to-equity ratio history on GURU.Markets, we note that the 0.03 metric determines this level. Dominance in the deepwater segment supports the share price, despite Western protectionist tariffs that periodically pressure the final margins of this steel behemoth.

Comprehensive metric breakdowns and analytics for Tenaris Corp (TS)
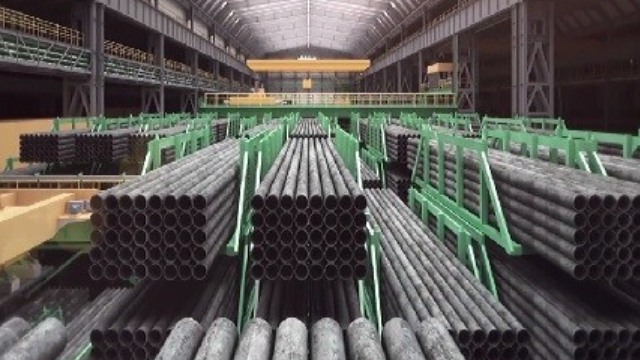
The global steel pipe production of Tenaris S.A. (TS) requires colossal capital expenditures in infrastructure across all continents. The total liabilities-to-equity ratio reflects the balance between borrowed funds and the issuer's net assets. This metric measures financial leverage and the extent of the business's dependence on external borrowing. By analyzing the historical changes in the total debt-to-equity ratio, an investor assesses the risk of cash flow gaps. The stability of this indicator confirms the resilience of the company's diversified model.