Tenaris Group (TS) - Price Chart

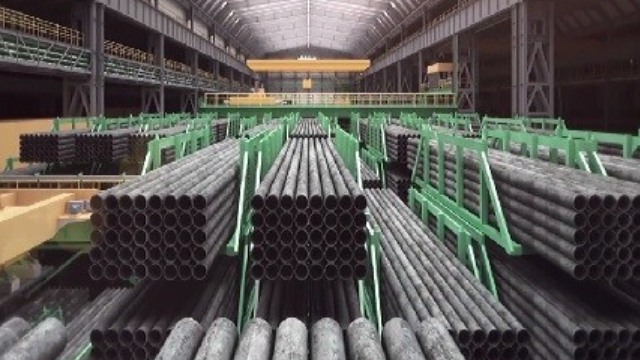
This price chart, serving as confirmation of the market valuation, demonstrates the asset's dynamics at the 61.15 level. Increased resource extraction driven by sanctions is boosting demand for products, although tariffs are weighing on profits. Tenaris S.A. (TS) relies on the production of indispensable pipes for deepwater hydrocarbon extraction. The company's leadership is based on the implementation of nanostructured alloys and innovations in the hydrogen transport sector.

Comprehensive metric breakdowns and analytics for Tenaris SA (TS)
The operational efficiency of Tenaris S.A. (TS) is based on cost optimization through the outsourcing of logistics and IT infrastructure. The price reflects the current market consensus regarding the value of a single share, capturing the balance between supply and demand. The dynamics of this indicator measure market capitalization in real time. Savings from outsourcing directly impact the investment attractiveness of the business. By analyzing changes in the security's price, an investor can identify the asset's consolidation phases.
