U.S. Energy Corp (USEG) - Price to Earnings Multiple

Corporate emblem and logo of U.S. Energy Corp (USEG)

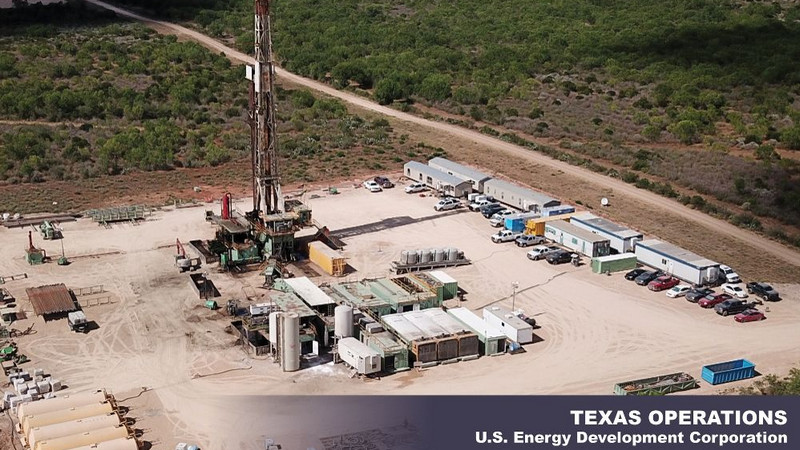
The U.S. Energy Corp. (USEG) price chart demonstrates the performance of a company whose profitability is tied to commodity prices and whose capital is constantly allocated toward exploring new resources due to well depletion, confirming the significance of -3.60. The business relies on external providers, outsourcing field operations entirely to contractors. Vulnerability to market cycles is exacerbated by a lack of unique assets and a dependence on aging Rocky Mountain deposits.

U.S. Energy Corp. (USEG) - P/E Multiple from 07/04/2022 to 06/08/2026

Analytical breakdowns for U.S. Energy Corp.
- current price and projected stock value:
General company analysis:usnrg.com - USEG
Core merchandise of usnrg.com

The closed shale ecosystem of U.S. Energy Corp. (USEG) with long-term off-take contracts makes the business resilient; however, the company's normalized P/E reflects how the market values this stability relative to current net income. This indicator measures the cost of one dollar of annual income, allowing investors to distinguish fundamental asset value growth from speculative price overheating through the price action on the chart.

Key competitors

Price to Earnings Multiple XOM (corporate.exxonmobil.com)|P/E Multiple CVX|Royal Dutch Shell - Price to Earnings Multiple|Total Energies - Price to Earnings Ratio|Company Value to Net Income COP|BP Group - P/E Multiple|Market Cap to Net Income Ratio cnrl.com (CNQ)|EOG: P/E Multiple|Equinor Group (EQNR) - P/E Multiple|Price to Earnings Ratio Marathon Petroleum Corp|P66 (PSX) - Business Payback Period|Price to Earnings Ratio SU (Suncor Energy Inc.)|E (eni.com) - Company Value to Net Income|P/E Multiple VLO (Valero)|Imperial Oil Ltd. (IMO) - Market Cap to Earnings|PBR: Price to Earnings Ratio|OXY (Occidental Petroleum Corp) - Price to Earnings Multiple|Diamondback Energy (FANG) - Price to Earnings Ratio|Market Cap to Net Income CVE (cenovus.com)|Price to Earnings Ratio EQT Production|Price to Earnings Ratio WDS|Price to Earnings Ratio Chesapeake Energy (EXE)|DVN - Market Cap to Earnings|Price to Earnings Ratio Ecopetrol S.A. EC|Company Value to Net Income CTRA|Permian Resources Corporation - P/E Multiple|OVV - P/E Multiple|YPF (YPF SA) - Price to Earnings Ratio|AR: Market Price to Net Income Ratio|DINO (HF Sinclair Corporation) - P/E Multiple|apacorp.com (APA) - Business Payback Period|Price to Earnings Ratio Range Resources Corporation (RRC)|NFG - Market Cap to Earnings|Price to Earnings Ratio Oasis Petroleum CHRD|MTDR: Price to Earnings Multiple|CRK: Price to Earnings Ratio|CRC - P/E Multiple|MGY (Magnolia Oil & Gas Corporation) - Price to Earnings Ratio|CNX - Business Payback Period|Price to Earnings Ratio Ultrapar|Sasol Corp (SSL) - Business Payback Period|Price to Earnings Ratio LB (LandBridge Company LLC)|Business Payback Period murphyoilcorp.com|PBF Energy - Price to Earnings Ratio|Company Value to Net Income VIST|CVR Refining - P/E Multiple|Market Cap to Earnings SM Energy Co|Gulfport Energy (GPOR) - Price to Earnings Ratio|Price to Earnings Multiple CIVI|EE (Excelerate Energy) - P/E Multiple|Market Cap to Earnings Sable Offshore Corp SOC|Price to Earnings Ratio Crescent Energy Inc. (CRGY)|BTE (Baytex) - Company Value to Net Income|P/E Multiple DK (Delek US Holdings, Inc.)|Market Cap to Net Income Ratio BKV Energy|PARR: Price to Earnings Ratio|Market Cap to Earnings NextDecade Corp|TALO (Talos Energy Inc) - Price to Earnings Ratio|Kimbell Corp - Company Value to Net Income|MNR (Mach Natural Resources LP) - P/E Multiple|Price to Earnings Ratio atlas.energy (AESI)|Price to Earnings Ratio Vermilion Energy (VET)|DEC - Market Cap to Earnings|Price to Earnings Ratio HighPeak Energy Corp HPK|Company Value to Net Income KOS|VTLE - Price to Earnings Ratio|Market Cap to Net Income REPX|EGY (VAALCO Energy) - Price to Earnings Ratio|SD - Business Payback Period|Price to Earnings Ratio OBE|P/E Multiple Tamboran Resources Inc.|Price to Earnings Ratio Greenfire Resources Ltd. (GFR)|Business Payback Period geo-park.com|P/E Multiple BRY (Berry Corp)|PrimeEnergy Resources Corp (PNRG) - Market Cap to Earnings|W&T Offshore, Inc - P/E Multiple|Market Cap to Net Income Ratio Houston American Energy (HUSA)|ringenergy.com (REI) - Price to Earnings Ratio|Market Cap to Earnings Kolibri Global Energy Inc. (KGEI)|EPM (Evolution Petroleum Corp.) - P/E Multiple|Amplify Energy Corporation (AMPY) - Business Payback Period|Price to Earnings Ratio Gran Tierra Energy Inc. (GTE)|Price to Earnings Ratio EP (empirepetroleumcorp.com)|Epsilon Energy Ltd. - Price to Earnings Ratio|Company Value to Net Income PROP|PEDEVCO Corporation - P/E Multiple|NRT - P/E Multiple|indo-energy.com (INDO) - Price to Earnings Ratio|Price to Earnings Multiple BATL|MXC (Mexco Energy) - P/E Multiple|Price to Earnings Multiple EONR (eon-r.com)|Price to Earnings Ratio BRN (Barnwell Industries)|MARPS (marps-marine.com) - Company Value to Net Income|P/E Multiple TPET (Trio Petroleum)|Market Cap to Net Income Ratio Peak Resources|STAK Energy - P/E Multiple|AE - P/E Multiple|Camber Energy (CEI) - Price to Earnings Ratio|CHK - Business Payback Period|Price to Earnings Ratio HES|MRO: Company Value to Net Income|P/E Multiple SBOW|SWN - Market Cap to Earnings|Tellurian - Price to Earnings Ratio|VRN: Price to Earnings Multiple