WWR Westwater Resources Inc. Operating Sales Margin

The deployment of a natural graphite processing plant for electric vehicles is driving the price action for Westwater Resources (WWR). The distribution of operating margins visualizes this engineering surge. 0.00 determines the latest efficiency metric. Prospects are based on the creation of an autonomous raw material processing cycle in the US, although high industry cyclicality and dependence on global metal prices maintain the asset's volatility.

westwaterresources.net - analytical breakdowns and key metrics (WWR)
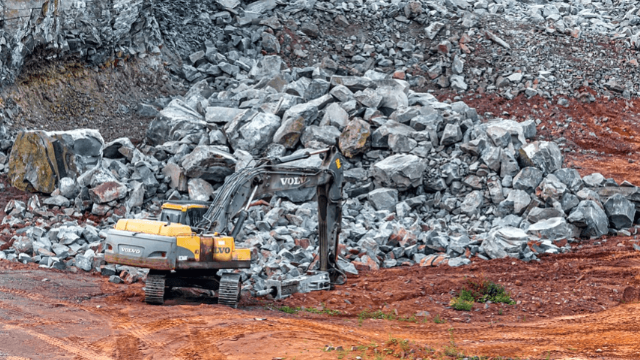
The development of graphite resources for the electric vehicle sector is subject to sharp raw material price fluctuations, which is reflected in the volatility of the historical operating margin. This ratio, calculated as operating income divided by revenue, demonstrates the efficiency of the core business excluding debt load, allowing investors to assess the resilience of the Westwater Resources (WWR) model to market cycles and the risk of capital stagnation.
