Westwater Resources Inc (WWR): Price-to-Revenue Coefficient

Symbol and logo of brand Westwater Resources Inc (WWR)

Westwater Resources (WWR) dependence on external engineering during plant construction drives current volatility, and the company's rolling P/S on GURU.Markets is displayed accounting for these costs, where is recorded as the baseline value. The recruitment of specialized geologists and chemists complements the technological leap in graphite purification for EV batteries, establishing the foundation for industrial launch.

WWR - Westwater Resources, Inc. Market Cap to Revenue over the range 07/04/2022 - 11/16/2026

Westwater Resources, Inc (WWR) - metric breakdowns and financial figures
- current quotes and average value forecast:
General company analysis:WWR - Westwater Resources Inc.
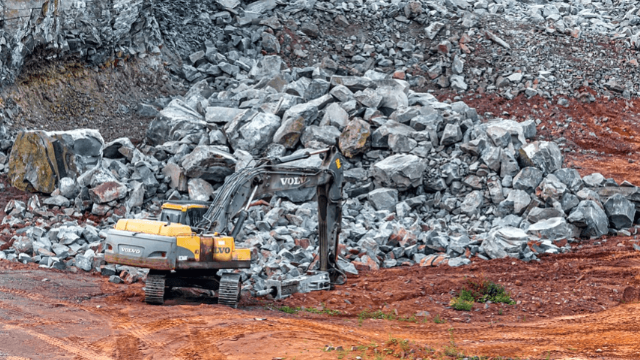
Signature product of Westwater Resources Inc.

The P/S ratio compares the market capitalization of Westwater Resources (WWR) to its annual revenue, measuring the cost of each dollar of sales. For Westwater Resources (WWR), this indicator reflects market expectations regarding future revenues from battery graphite production amid stringent EPA environmental regulations. By analyzing the P/S multiple chart, an investor can track valuation compression against high capital expenditures. This price action allows for the differentiation between a fundamental business decline and a temporary undervaluation of assets.

Competitors of Westwater Resources

BHP (BHP Billiton) - Market Capitalization-to-Revenue Ratio|Price-to-Revenue Ratio southerncoppercorp.com SCCO|Rio Tinto Group (RIO) - Price to Sales|Freeport - P/S Multiple|teck.com (TECK) - Market Cap to Revenue|PAAS (Pan American Silver Corp.) - Market Cap to Revenue|MP: Market Cap to Sales Volume|Price-to-Revenue Ratio Allegheny Technologies|Market Cap to Revenue Alcoa Corp. (AA)|Market Cap to Revenue HBM (Hudbay Minerals Inc.)|BVN - Price to Sales|azargauranium.com - Market Cap to Revenue|Century Aluminum Co. (CENX) - Price to Sales|MTRN - Price-to-Revenue Ratio|TMC the metals company Inc. (TMC) - Market Cap to Revenue|CSTM: P/S Multiple|SKE - Price-to-Revenue Coefficient|Market Cap to Revenue ERO|P/S Multiple Kaiser Aluminum Corp|Market Cap to Revenue IE (Ivanhoe Electric)|PRLB (Proto Labs Inc) - Market Capitalization-to-Revenue Ratio|Taseko Mines Limited - Market Cap to Revenue|Price-to-Revenue Coefficient Almonty Industries (ALM)|SLSR: Market Cap to Revenue|Lithium Americas (LAC) - Market Cap to Revenue|UAMY (US Antimony Corp) - Market Cap to Revenue|NEXA - Price-to-Revenue Coefficient|SGML (Sigma Lithium Inc.) - P/S Multiple|Market Cap to Revenue Standard Lithium (SLI)|P/S Multiple LAR|NAK (Northern Dynasty Minerals Ltd) - Market Capitalization-to-Revenue Ratio|Price-to-Revenue Ratio Eurasian Minerals EMX|Market Cap to Sales Volume NB (NioCorp Corp)|NEWP - Price-to-Revenue Ratio|Lifezone Metals Limited (LZM) - Market Cap to Revenue|TMQ (Trilogy Metals Inc.) - Market Cap to Revenue|Price-to-Revenue Multiple Western Copper & Gold WRN|IONR (ioneer.com) - P/S Multiple|Price to Sales Namib Minerals NAMM|P/S Multiple BOOM|P/S Multiple Comstock Inc (LODE)|Price-to-Revenue Ratio nexmetalsmining.com NEXM|atlas-lithium.com - Price-to-Revenue Ratio|FMST: Market Cap to Revenue|Snow Lake Resources Ltd. (LITM) - Market Cap to Revenue|Electra Battery Materials (ELBM) - Price-to-Revenue Ratio|BURU (NUBURU) - Price-to-Revenue Ratio|CHNR (China Natural Resources, Inc.) - P/S Multiple|Price-to-Revenue Ratio AQMS|Price-to-Revenue Ratio Sayona Mining Corp (ELVR)|Price-to-Revenue Coefficient American Lithium Corp|Haynes International, Inc. - Market Cap to Revenue|LAAC - Market Cap to Revenue|PLL - Price-to-Revenue Ratio