cbdMD, Inc. (YCBD): Price to Earnings Adjusted for Growth Rate

Symbol and logo of brand cbdMD, Inc. (YCBD)

The PEG ratio demonstrates the fundamental value of cbdMD, Inc. (YCBD) amid regulatory risks and pricing pressure within the CBD sector. 0.00 captures the current state of this parameter as the company implements ESG standards through eco-friendly packaging and sustainable farming. The asset is currently hitting a cyclical bottom, restructuring sales toward a direct-to-consumer online channel to combat declining demand.

YCBD - cbdMD Inc. PEG Multiple over the range 07/04/2022 - 11/10/2026
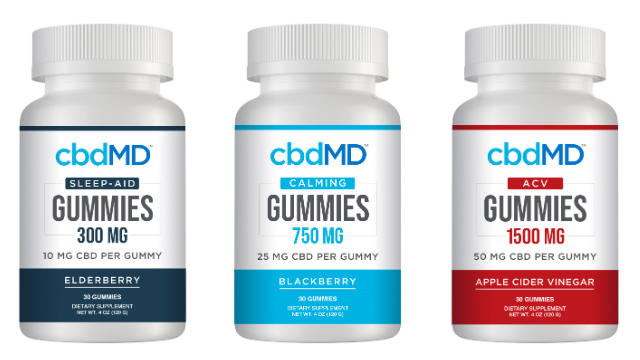
Mass-produced product of cbdMD

To objectively evaluate cbdMD, Inc. (YCBD), it is necessary to compare the business's market value with its earnings growth, which is achieved via the PEG growth stock filter. This indicator determines the degree of the asset's undervaluation: a value below one signals growth potential, which is critically important for cbdMD, Inc. (YCBD) during its period of online distribution optimization and as it overcomes a cyclical downturn in demand for CBD products.

Competing companies

HLN (Haleon PLC) - Growth-Adjusted Payback Ratio|Price/Earnings to Growth Ratio Kenvue Corp KVUE|Verona Pharma Inc. (VRNA) - Price to Earnings Adjusted for Growth Rate|MENS: Price/Earnings to Growth Multiple|ligand.com - Company Value to Earnings Growth Ratio|AMRX: PEG Multiple|Perrigo Company PLC - Growth-Adjusted Payback Ratio|ALVO (Alvotech Corp) - PEG Multiple|Price to Earnings Adjusted for Growth Rate Liquidia Inc. LQDA|Price/Earnings to Growth Ratio Galapagos NV (GLPG)|ANIP (anipharmaceuticals.com) - Growth-Adjusted Payback Ratio|PEG Multiple MNKD (MannKind)|AMPH - Price/Earnings to Growth Multiple|Pacira - PEG Multiple|SPRY: Price/Earnings to Growth Ratio|TBPH: PEG Multiple|Growth-Adjusted P/E Ratio AQST|Price/Earnings to Growth Ratio scPharmaceuticals, Inc.|Price/Earnings to Growth Multiple Tectonic (TECX)|PEG Multiple TNXP|sxtchina.com - Growth-Adjusted P/E Ratio|Eupraxia Pharmaceuticals Inc. - Price/Earnings to Growth Multiple|Growth-Adjusted Payback Ratio BHST|eXoZymes - PEG Multiple|Growth-Adjusted Market Cap to Net Income Oramed Pharmaceuticals ORMP|enterabio.com (ENTX) - Price/Earnings to Growth Ratio|Growth-Adjusted P/E Ratio HYFT|ABVC (ABVC BioPharma) - PEG Multiple|Price/Earnings to Growth Multiple cumberlandpharma.com (CPIX)|Price/Earnings to Growth Multiple QNTM (Quantum BioPharma)|Growth-Adjusted Market Cap to Net Income FibroGen Inc|Telomir Pharma - Price/Earnings to Growth Multiple|Rani Therapeutics Holdings (RANI) - Price to Earnings Adjusted for Growth Rate|Synergy CHC Corporation - PEG Multiple|Rallybio Corporation (RLYB) - Price/Earnings to Growth Multiple|LEXX: PEG Multiple|PULM (Pulmatrix Inc) - Price/Earnings to Growth Ratio|PTHL (Pheton Holdings Limited) - PEG Multiple|Growth-Adjusted P/E Ratio APM (Aptorum)|Price/Earnings to Growth Ratio Lyra Therapeutics, Inc. (LYRA)|IBO: Market Cap to Earnings and Growth Ratio|PEG Multiple TNFA (TNF Pharmaceuticals, Inc.)|Growth-Adjusted Payback Ratio PRFX|Auris Medical - PEG Multiple|LIPO - PEG Multiple|OptiNose, Inc. (OPTN) - Price/Earnings to Growth Ratio|pieris.com - Growth-Adjusted Payback Ratio|Price/Earnings to Growth Ratio Procaps|Price/Earnings to Growth Multiple Petros Pharmaceuticals Inc (PTPI)|PEG Multiple QLI|PEG Multiple ACELYRIN Inc. (SLRN)|TFF Pharmaceuticals - Price/Earnings to Growth Multiple