YCBD: cbdMD Company Value to Net Income

Corporate emblem and logo of cbdMD (YCBD)

cbdMD, Inc. (YCBD) is developing a wellness ecosystem by offering digital sales of CBD products for humans and pets. The business relies on the US market, where it faces regulatory pressure and logistics inflation, forcing the company to optimize expenses. The current metric stands at -1.50, and the price chart on the GURU.Markets platform confirms the impact of these factors on the market value of the issuer's assets.

YCBD cbdMD Inc.: Price to Earnings Ratio in the range 07/04/2022 - 11/12/2026
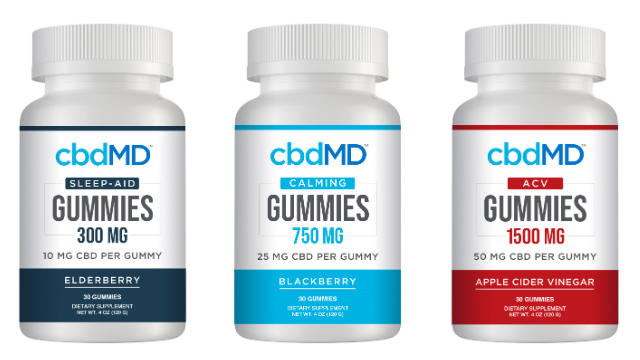
Flagship merchandise of cbdMD

Investors are assessing fundamental capital risks through the lens of the ratio between market price and actual earnings. For cbdMD, Inc. (YCBD), this analysis is complicated by regulatory uncertainty and advertising restrictions. The P/E valuation metric measures the investment payback period by relating market capitalization to net income. This chart reflects an overpayment for future growth, as high values signal inflated expectations despite persisting operational barriers.

Key competitors

P/E Multiple haleon.com|Price to Earnings Ratio KVUE (Kenvue)|VRNA (Verona Pharma PLC) - Company Value to Net Income|Price to Earnings Ratio Jyong Biotech Corp MENS|Ligand Corp (LGND) - Market Cap to Earnings|AMRX: Price to Earnings Ratio|perrigo.com - Market Price to Net Income Ratio|ALVO: P/E Multiple|Liquidia Corp - Company Value to Net Income|GLPG (Galapagos Genomics) - P/E Multiple|Market Cap to Earnings ANI Pharmaceuticals Corp ANIP|Price to Earnings Ratio MannKind Corporation (MNKD)|AMPH (amphastar.com) - Company Value to Net Income|P/E Multiple PCRX (Pacira BioSciences, Inc.)|SPRY - Price to Earnings Ratio|Theravance - P/E Multiple|AQST: Price to Earnings Ratio|SCPH: P/E Multiple|Price to Earnings Multiple TECX|Price to Earnings Ratio Tonix Pharmaceuticals Holding Corp.|Price to Earnings Ratio SXT China (SXTC)|P/E Multiple EPRX|BioHarvest Sciences Inc - Price to Earnings Multiple|eXoZymes Inc - Price to Earnings Ratio|Company Value to Net Income ORMP|Entera Bio Corp - P/E Multiple|Business Payback Period MindWalk Holdings, Inc. HYFT|ABVC BioPharma Inc (ABVC) - Price to Earnings Ratio|Price to Earnings Multiple CPIX|QNTM (Quantum BioPharma Ltd) - P/E Multiple|Price to Earnings Ratio fibrogen.com (FGEN)|Price to Earnings Ratio TELO (Telomir Pharmaceuticals, Inc.)|Business Payback Period ranitherapeutics.com|Synergy CHC - Price to Earnings Ratio|Rallybio Corp (RLYB) - Market Cap to Earnings|Lexaria - P/E Multiple|pulmatrix.com (PULM) - Price to Earnings Ratio|PTHL: P/E Multiple|APM (Aptorum Group) - Price to Earnings Ratio|LYRA (Lyra Therapeutics, Inc) - P/E Multiple|Price to Earnings Multiple IBO (Impact BioMedical, Inc.)|Price to Earnings Ratio TNF Pharmaceuticals (TNFA)|PRFX: Market Cap to Net Income|P/E Multiple CYTO (Altamira Therapeutics Ltd.)|Company Value to Net Income LIPO|Optinose - P/E Multiple|PIRS - P/E Multiple|Procaps Group S.A. (PROC) - Price to Earnings Ratio|petrospharma.com - Company Value to Net Income|Price to Earnings Ratio Qilian International Holding|Price to Earnings Ratio Acelyrin Inc. (SLRN)|P/E Multiple TFFP