ZK International Group Co., Ltd. - ZKIN Price Chart

The ZK International (ZKIN) market price chart illustrates the price action of an asset whose business relies on metallurgy. Quotations depend on global demand and border openness, as sanctions and trade barriers impact exports. The current indicator stands at 1.48, while rising raw material costs limit the returns from government contracts, and protectionist measures in China complicate the sale of pipes in the West.

Metric breakdowns and analytics for ZK International (ZKIN)
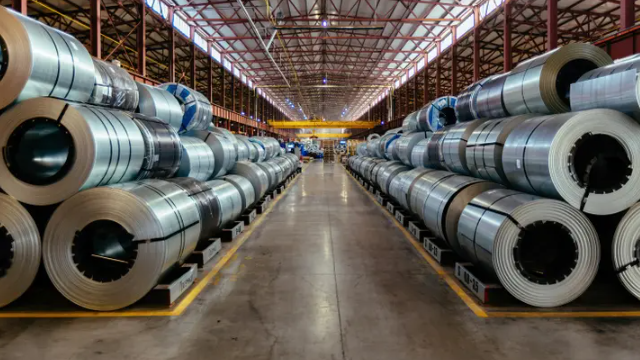
The closing price forms the basis for calculating market capitalization, reflecting the aggregate value of all shares in real time. This indicator allows for an assessment of how demand for infrastructure steel components in China impacts the investment attractiveness of ZK International (ZKIN), which is clearly captured by market asset quotes when analyzing volatility and long-term business value trends.
