Enterprise Value to EBITDA Ratio: ZOOZ Power, Ltd. (ZOOZ)

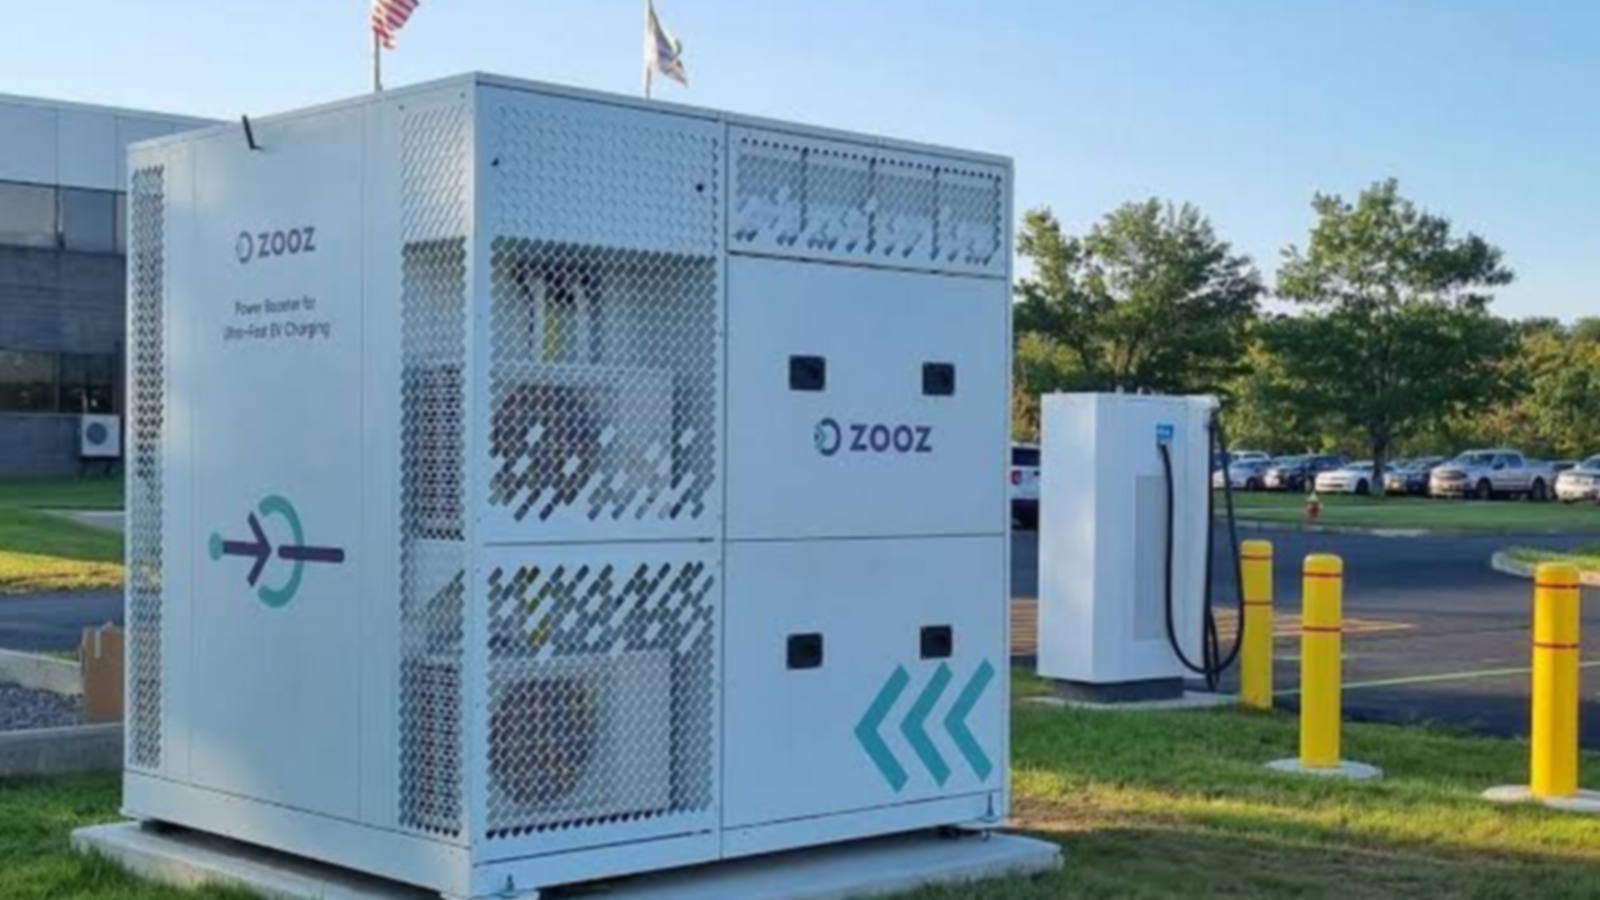
This EV/EBITDA chart for ZOOZ Power Ltd. (ZOOZ) demonstrates a metric of 0.00. The brand develops secure kinetic installations for ultra-fast charging, earning recognition from gas station operators. Storage assembly is localized in stable zones, eliminating the risk of port delays. The expansion of the electromobility network relies on joint pilot projects for the implementation of energy storage systems with key partners.

Financial and market metric breakdowns for zoozpower.com (ZOOZ)
The EV/EBITDA multiple compares the total enterprise value to operating profit before depreciation and amortization, allowing for an assessment of capital efficiency regardless of debt load or tax regimes. By analyzing the EV/EBITDA history of ZOOZ Power Ltd. (ZOOZ), an investor can determine the extent to which the market price aligns with the expansion potential of flywheel charging systems in the US and Europe, confirming the fundamental stability of its technological leadership.
