zoozpower.com (ZOOZ) - Business Payback Period

ZOOZ Power Ltd - graphic logo of issuer ZOOZ

The ZOOZ Power Ltd. (ZOOZ) market price chart reflects the dynamics of a company developing flywheel energy storage systems for EV fast-charging, where efficiency gains are expected via network software, and the indicator stands at -0.40. Human capital is secured by a strong team of electronics engineers incentivized through stock option programs. The business is currently at the start of its sales phase, meaning its sustainability is directly tied to the expansion of charging station infrastructure.

Price to Earnings Ratio: ZOOZ Power, Ltd. (ZOOZ) for 04/06/2024 - 11/11/2026
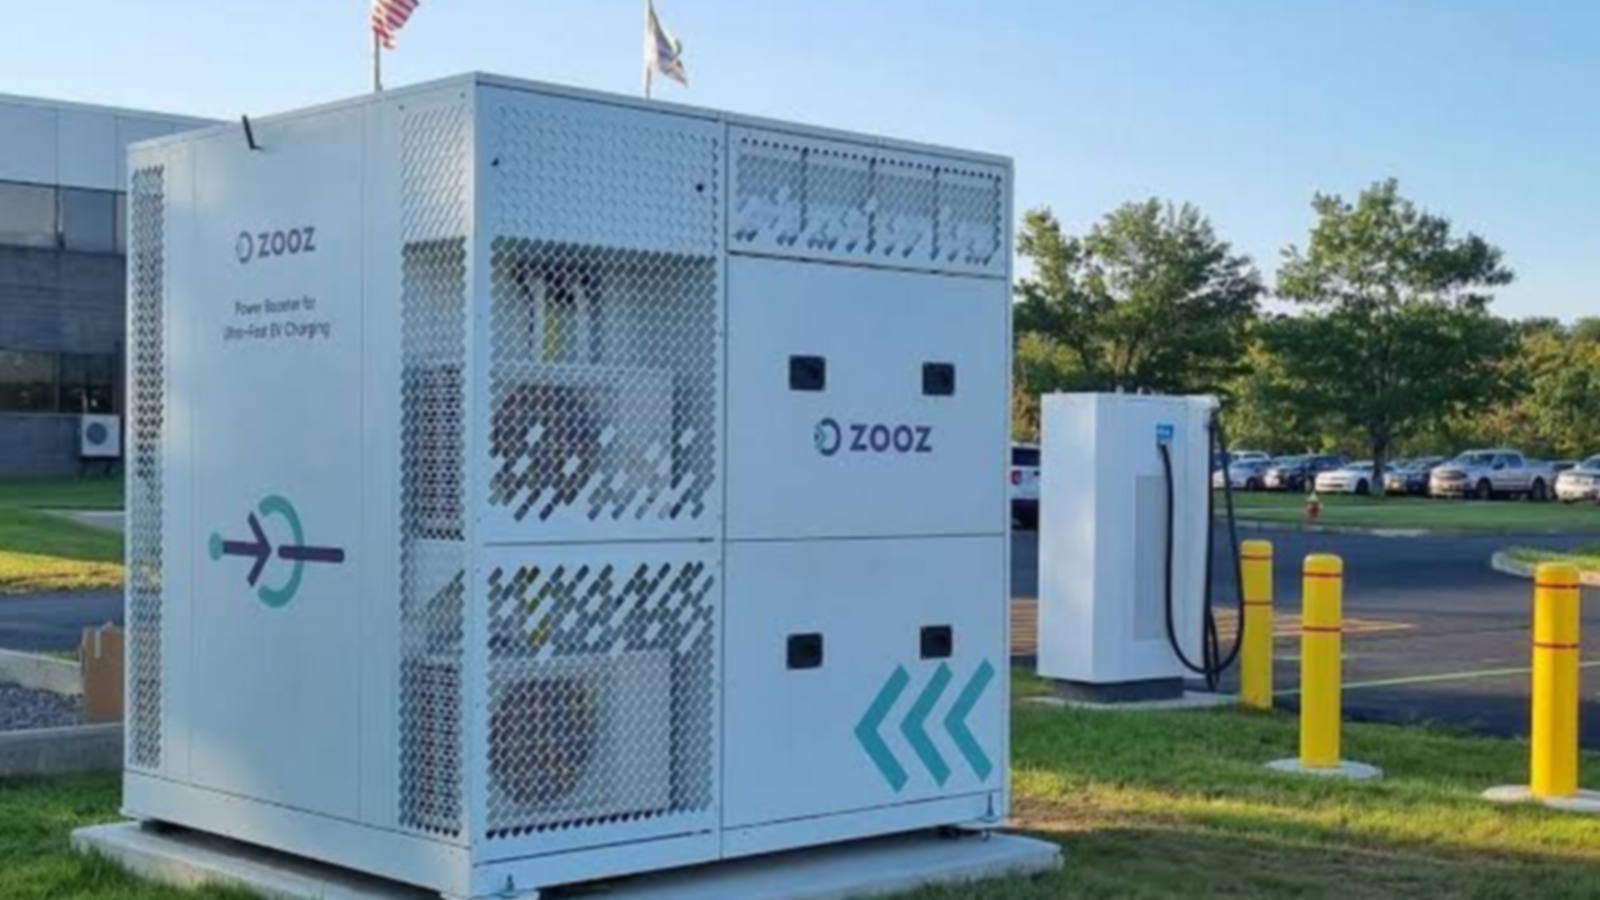
Original product of ZOOZ Power

ZOOZ Power Ltd. (ZOOZ) faces negative or unstable profit calculations due to high infrastructure deployment costs for charging stations coupled with low current revenue. This metric correlates market capitalization with net income to determine the theoretical payback period while filtering out market noise. An analysis of the company's quarterly P/E allows for an assessment of the business's intrinsic value, avoiding overpayment for momentary speculative spikes.

Competing companies

TSLA: Company Value to Net Income|P/E Multiple LI|Business Payback Period Rivian Automotive|P/E Multiple XPEV (Xiaopeng Motors)|NIO - Price to Earnings Ratio|JOBY: Price to Earnings Ratio|Market Cap to Net Income ZK|VinFast (VFS) - Price to Earnings Ratio|Market Cap to Earnings Lucid Motors (LCID)|Price to Earnings Ratio QuantumScape Inc.|Market Cap to Earnings Polestar Corp PSNY|Price to Earnings Ratio ENVX (Enovix Corporation)|AMPX: Market Cap to Net Income|EVgo - Price to Earnings Ratio|Company Value to Net Income LOT|MVST - Price to Earnings Ratio|Market Cap to Net Income LVWR|Solid Power, Inc. (SLDP) - Price to Earnings Ratio|Market Cap to Earnings nwtnmotors.com (AIIO)|Price to Earnings Ratio HYLN|Price to Earnings Ratio Niu Tech (NIU)|P/E Multiple ELVA|FFAI - Market Cap to Earnings|Price to Earnings Ratio ChargePoint Holdings CHPT|Company Value to Net Income ABAT|NVX: Price to Earnings Ratio|Company Value to Net Income BLNK (Blink Charging Co.)|Kandi Technologies Group, Inc. (KNDI) - Price to Earnings Ratio|CBAT (CBAK Tech) - Price to Earnings Ratio|Price to Earnings Ratio WBX|XCH (xcharge.com) - Market Price to Net Income Ratio|P/E Multiple JZXN|Beam Global Inc - Price to Earnings Multiple|Cenntro Electric Group - Price to Earnings Ratio|Business Payback Period Stardust Power Inc (SDST)|GTEC: Price to Earnings Ratio|Market Cap to Net Income EPOW|xostrucks.com (XOS) - Price to Earnings Ratio|Market Cap to Earnings Dragonfly Energy Holdings Corp. (DFLI)|Price to Earnings Ratio Workhorse Group Inc|Market Cap to Earnings Elong Power Corp ELPW|Price to Earnings Ratio SSM (Sono Group N.V)|FLYE: Market Cap to Net Income|P/E Multiple STI (Solidion Technology)|GreenPower Motor Company Inc. (GP) - Market Cap to Earnings|UCAR - Price to Earnings Ratio|EVTV: Price to Earnings Ratio|LOBO: P/E Multiple|Market Cap to Earnings nuvve.com (NVVE)|CJET (Chijet Motor Company, Inc.) - P/E Multiple|Price to Earnings Ratio NaaS Technology Inc (NAAS)|Price to Earnings Ratio EZGO (EZGO Technologies Ltd.)|Market Price to Net Income Ratio BINI|Price to Earnings Ratio Scage International SCAG|Company Value to Net Income AIEV|Allego EV - P/E Multiple|Business Payback Period Ayro, Inc. AYRO|FFIE: P/E Multiple|Price to Earnings Ratio Canoo|Price to Earnings Ratio HYZN|Lion Electric - Market Cap to Net Income|Price to Earnings Ratio Mullen (MULN)|PEV - Market Cap to Earnings|Price to Earnings Ratio SRIVARU Holding Ltd SVMH|Volcon Inc. (VLCN) - Market Cap to Earnings|ZAPP: Price to Earnings Ratio|Market Cap to Net Income FSR