FRD: מקדם מחיר להכנסות Friedman Industries Incorporated
High barriers to entry in the steel sector are driven by massive infrastructure costs and raw material dependency. The price-to-sales ratio trend shows a prolonged sideways movement, where 0.30 represents the latest metric reading. Friedman Industries (FRD) relies on the US B2B metalworking segment. A lack of debt combined with standard liquidity effectively mitigates financial risks amid rolled steel price volatility.

פילוחים אנליטיים של חברת Friedman Industries, Inc. (FRD)
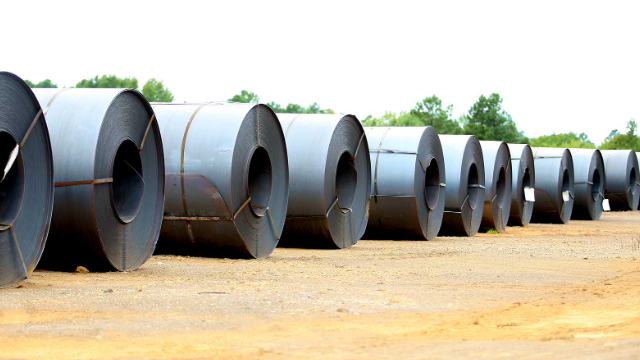
Friedman Industries strategic alliances in the steel recycling sector optimize supply chains, directly impacting revenue generation and the asset's market value. An analysis of the company's P/S ratio allows for the valuation of each dollar of sales through capitalization, helping investors identify whether the business is undervalued or if quotes are overheated, based on market capacity dynamics reflected in the company's P/S ratio.
