LUD: יחס שווי שוק להכנסות Luda Technology Group Ltd
Luda Technology Group (LUD) is seeing business margins expand through the integration of robotics into foundry production, which minimizes manual labor. This price-to-sales chart clearly demonstrates capitalization resilience, while the 3.30 value remains steady at current levels. Growth is driven by exports and Chinese demand for specialty steel, while cyclicality risks are offset by supplies to the housing and utilities and oil and gas sectors.

פילוחים אנליטיים של חברת Luda Technology Group (LUD)
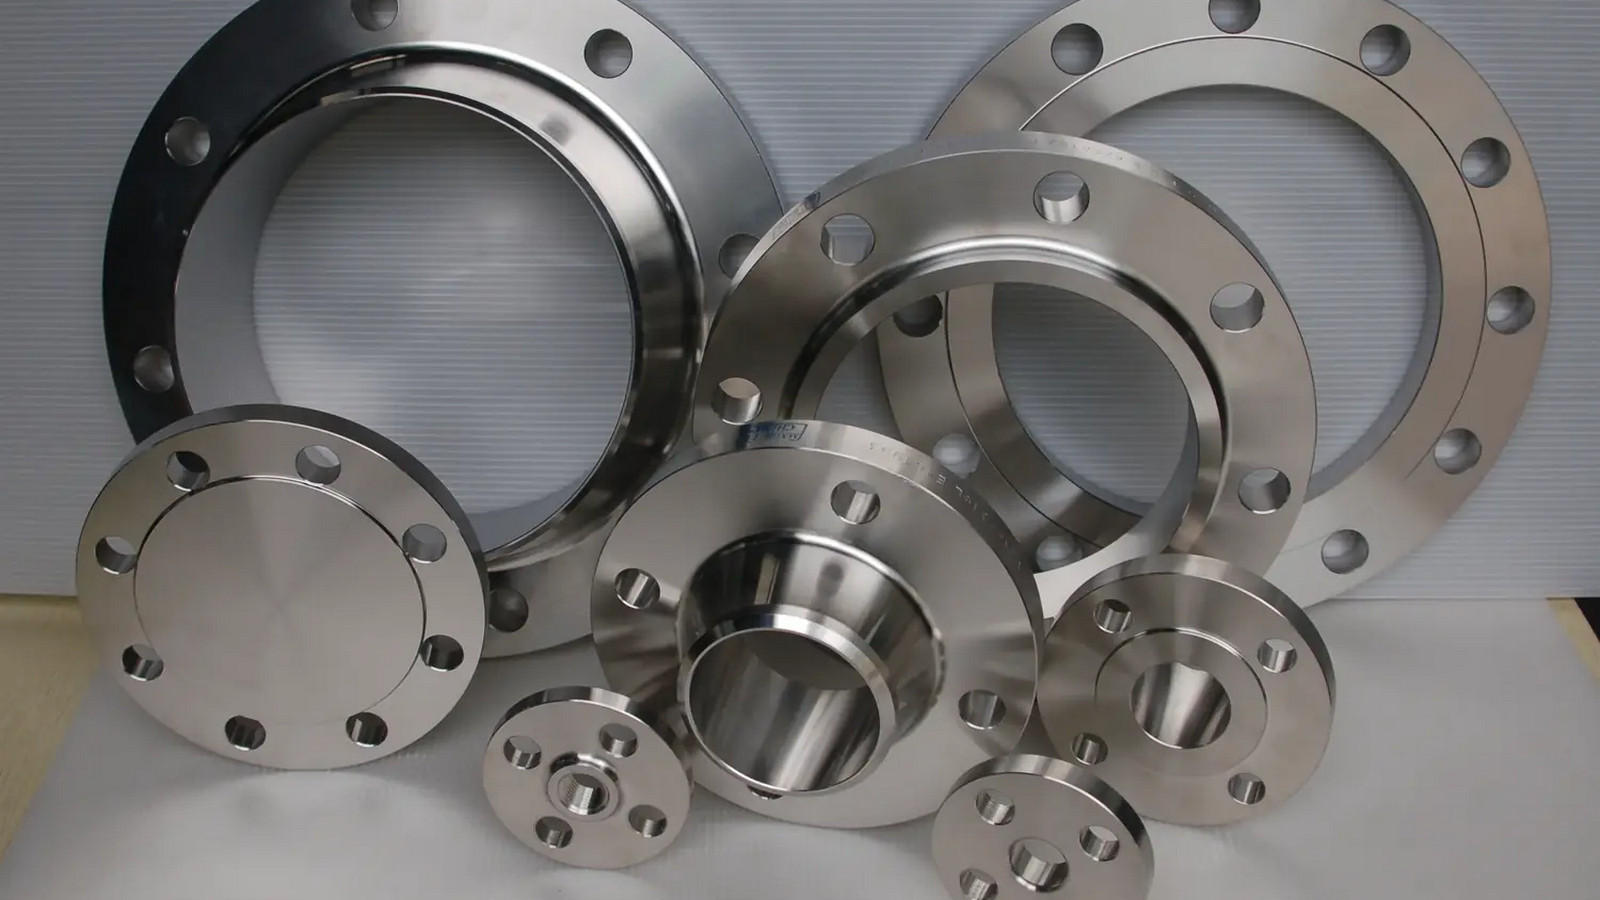
The expansion dynamics of Luda Technology Group (LUD) in the precision steel casting sector are directly reflected in the market capitalization-to-revenue ratio. This multiple compares the total business value with annual sales volume, allowing for the determination of whether assets are overvalued or undervalued, which is critical for analyzing the scaling efficiency of the company's infrastructure projects.
