syndax.com (SNDX) - מזומנים למניה
The cash position per share chart for Syndax Pharmaceuticals (SNDX) on GURU.Markets demonstrates liquidity dynamics, where 4.74 characterizes this valuation parameter. Growth is supported by epigenetic developments that restore tumor sensitivity to therapy. However, volatility is driven by dependence on FDA verdicts and the high cost of research, while revenue stability is limited by strict distribution protocols for leukemia treatment drugs.

פילוחי מדדים מקיפים ואנליטיקה עבור Syndax Pharmaceuticals, Inc. (SNDX)
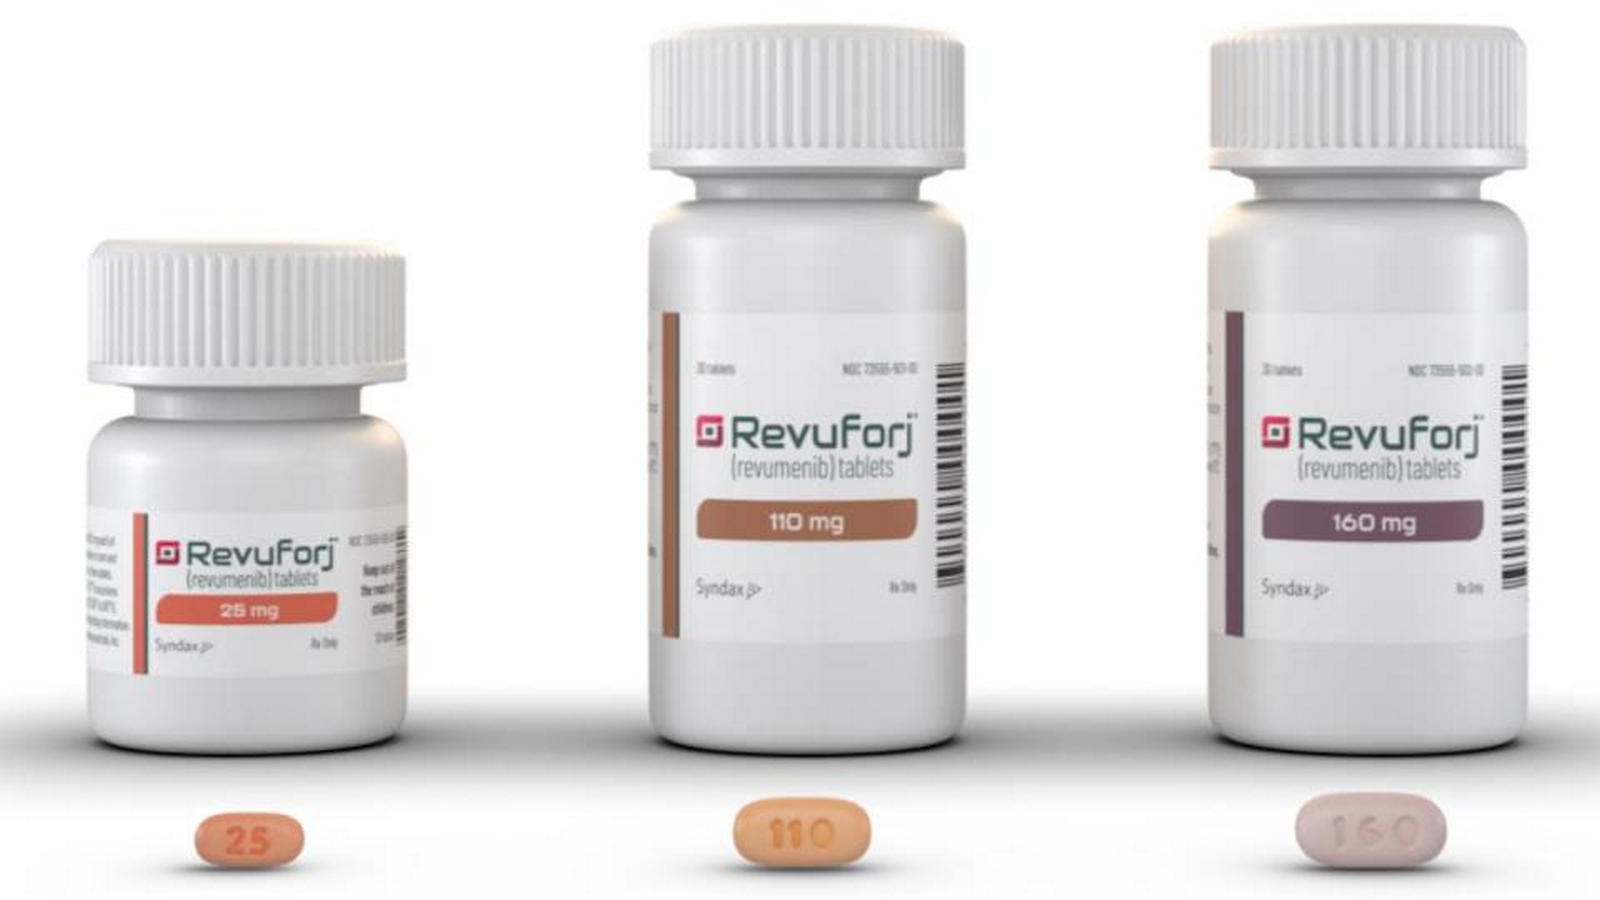
To identify fundamentally resilient assets, investors evaluate liquidity per share to determine a business's margin of safety against its debt obligations. The current value of 4.74 reflects the ability of Syndax Pharmaceuticals (SNDX) to fund revumenib clinical trials and expansion within the hemato-oncology segment without external borrowing, a fact confirmed by the trend in cash per share.
