atimetals.com (ATI) Forward Price-to-Revenue Multiple

Public company logo of Allegheny Technologies (ATI)

ATI Inc. (ATI) revenues are based on the peak of the commodity cycle amid high industrial demand. P/S expectations for the company visualize the market valuation trend, where the 3.30 level reflects the current multiple. This confirms the company's status as a reliable defense partner and its diversification through the production of titanium and nickel alloys for medicine and aerospace.

ATI Inc - ATI Market Cap to Expected Sales Ratio (period 07/04/2022 - 11/13/2026)

Summary analytical data breakdowns for atimetals.com (ATI)
- current price and projected stock value:
Comprehensive company analysis:Allegheny Technologies Incorporated ATI
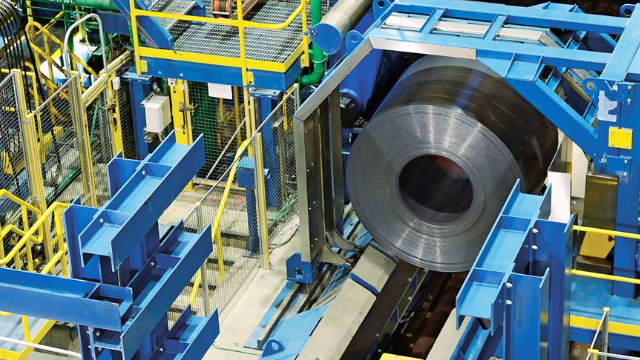
Product sample of ATI Inc

This indicator reflects the sensitivity of market value to expected cash flows, capturing the reaction of the forward revenue multiple to the cost of capital. This metric measures investment expectations regarding sales, where extreme values signal that an asset is overvalued. For ATI Inc. (ATI), this is critical when launching innovative titanium alloys to the market; therefore, the company's forward P/S chart helps determine the entry point.

Competitors of ATI Inc.

Forward P/S Multiple BHP (BHP Group)|Market Cap to Expected Sales Ratio Southern Copper Corp (SCCO)|RIO: Forward Price-to-Revenue Multiple|Forward Price to Sales FCX (Freeport Corp)|TECK: Forward P/S Multiple|PAAS - Market Cap to Expected Sales Ratio|Price-to-Projected Revenue Ratio MP Materials|Market Cap to Projected Revenue AA (Alcoa Corp)|Forward P/S Multiple HBM|Forward Price-to-Revenue Multiple Buenaventura Corp BVN|AZZ Inc - Forward Price-to-Revenue Multiple|Market Cap to Expected Sales Ratio centuryaluminum.com (CENX)|Materion - Forward P/S Multiple|TMC - Forward P/S Multiple|CSTM (Constellium Corp) - Forward Price-to-Revenue Multiple|SKE: Price to Expected Revenue Ratio|ERO (Ero Copper Corp.) - Forward P/S Multiple|kaiseraluminum.com (KALU) - Market Cap to Expected Sales Ratio|Price-to-Projected Revenue Ratio Ivanhoe Electric (IE)|Forward Price-to-Revenue Multiple Protolabs PRLB|Forward P/S Multiple TGB (Taseko)|Almonty Corp (ALM) - Market Cap to Future Revenue Ratio|SLSR: Forward Price-to-Revenue Multiple|lithiumamericas.com - Price to Expected Revenue Ratio|UAMY: Forward P/S Multiple|Nexa Resources SA (NEXA) - Forward P/S Multiple|Price-to-Projected Revenue Ratio Sigma Lithium Resources|Price-to-Projected Revenue Ratio SLI|Forward Price-to-Revenue Multiple LAR (Lithium Argentina AG)|NAK (northerndynastyminerals.com) - Forward Price to Sales|Forward P/S Multiple EMX (EMX Royalty)|NB - Forward Price-to-Revenue Multiple|NEWP - Price-to-Projected Revenue Ratio|Market Cap to Future Revenue Ratio Lifezone Group|Trilogy Metals Inc. (TMQ) - Price-to-Projected Revenue Ratio|WRN (westerncopperandgold.com) - Price-to-Projected Revenue Ratio|Price-to-Projected Revenue Ratio ioneer|Market Cap to Future Revenue Ratio Namib Minerals Corporation NAMM|Price-to-Projected Revenue Ratio DMC Global Inc (BOOM)|LODE (comstockmining.com) - Forward Price to Sales|Forward P/S Multiple NEXM (NexMetals Mining)|Forward P/S Multiple Atlas Lithium Corporation ATLX|WWR: Forward Price-to-Revenue Multiple|Foremost Lithium - Price to Expected Revenue Ratio|LITM: Forward P/S Multiple|ELBM - Market Cap to Expected Sales Ratio|Forward Price-to-Revenue Multiple BURU|CHNR: Forward Price to Sales|Forward P/S Multiple AQMS|Market Cap to Expected Sales Ratio Sayona Mining Ltd|Price-to-Projected Revenue Ratio American Lithium AMLI|HAYN: Market Cap to Projected Revenue|Lithium Americas - Forward P/S Multiple|piedmontlithium.com (PLL) - Forward Price-to-Revenue Multiple