Allegheny Technologies (ATI) Market Cap to Earnings

Allegheny Technologies - graphic logo of issuer ATI

ATI Inc. is transforming into a steady profit generator thanks to long-term aviation certifications. The P/E market valuation clearly demonstrates the price dynamics, while the 44.20 indicator determines the magnitude of the metric. ATI Inc. is expanding its portfolio through nickel alloys for medicine and energy, and its technological superiority in the defense sector creates a powerful barrier for competitors.

ATI - ATI Inc Price to Earnings Ratio over the range 07/04/2022 - 11/11/2026
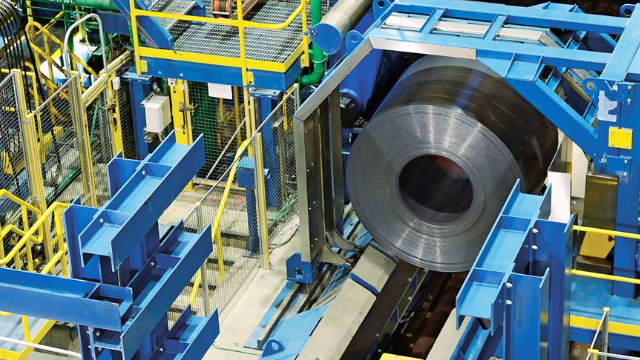
Flagship merchandise of ATI Inc

The P/E ratio determines the market value of a business relative to its net income, signaling the degree of asset overvaluation. For ATI Inc. (ATI), the company's adjusted P/E reflects its ability to generate income amid energy-intensive titanium production and ESG modernization costs. This chart captures the resilience of earnings against fiscal risks and the cost of the ecological transition. A low multiple confirms investment attractiveness provided that government support remains in place.

Key competitors

Price to Earnings Ratio BHP Group Ltd (BHP)|Price to Earnings Ratio Southern Copper Corporation (SCCO)|RIO - Market Cap to Earnings|Price to Earnings Ratio Freeport-McMoRan Copper & Gold FCX|Teck Cominco - Price to Earnings Ratio|PAAS - Price to Earnings Ratio|Market Cap to Earnings mpmaterials.com|Alcoa (AA) - Price to Earnings Ratio|Hudbay Minerals Inc - Company Value to Net Income|BVN (Buenaventura Mining) - P/E Multiple|P/E Multiple AZZ Galvanizing|Price to Earnings Ratio CENX (Century Aluminum)|Market Price to Net Income Ratio MTRN|P/E Multiple TMC (TMC the metals company Inc.)|Business Payback Period Constellium NV (CSTM)|SKE: Price to Earnings Ratio|Company Value to Net Income ERO (Ero Copper Inc.)|KALU: P/E Multiple|IE - Business Payback Period|Price to Earnings Ratio Proto Labs|Price to Earnings Multiple TGB (Taseko Mines Ltd)|P/E Multiple ALM|Price to Earnings Ratio Solaris Resources Corp SLSR|Lithium Americas Corp. - Price to Earnings Ratio|Business Payback Period usantimony.com (UAMY)|Nexa Resources - P/E Multiple|SGML - P/E Multiple|SLI (Standard Lithium Corp) - Price to Earnings Ratio|LAR: Market Price to Net Income Ratio|NAK (Northern Dynasty Minerals) - P/E Multiple|emxroyalty.com (EMX) - Business Payback Period|Price to Earnings Ratio NioCorp Developments (NB)|Price to Earnings Ratio New Pacific Metals Corp NEWP|P/E Multiple LZM (Lifezone Metals Corp)|NovaCopper (TMQ) - Market Cap to Earnings|WRN: Price to Earnings Ratio|ioneer.com - Market Price to Net Income Ratio|NAMM: P/E Multiple|DMC Global, Inc. (BOOM) - P/E Multiple|Price to Earnings Ratio Comstock Inc|Price to Earnings Ratio NEXM|Price to Earnings Ratio ATLX (Atlas Lithium)|WWR (westwaterresources.net) - Company Value to Net Income|P/E Multiple FMST (Foremost Lithium Resources & Technology)|LITM - Price to Earnings Ratio|ELBM - Price to Earnings Ratio|Market Cap to Earnings Nuburu, Inc.|China Natural Resources, Inc. (CHNR) - Price to Earnings Ratio|AQMS (Aqua Metals Inc.) - Price to Earnings Ratio|Price to Earnings Ratio Sayona Mining|Market Cap to Earnings American Lithium Corporation AMLI|Price to Earnings Ratio Haynes International (HAYN)|LAAC (Lithium Argentina) - Company Value to Net Income|P/E Multiple PLL (Piedmont Lithium Inc.)