ATI: ATI Inc. Price-to-Revenue Coefficient

Corporate company logo of Allegheny Technologies Incorporated (ATI)

Can ATI Inc. maintain the stability of specialty alloy supplies while diversifying its routes? The answer lies in its capital-intensive plants in the US, which guarantee the reliability of aerospace shipments. The price-to-sales ratio confirms the success of Robert Weatherbee's strategy to pivot toward premium titanium, with this metric standing at 5.10, reflecting the current phase of the market cycle.

ATI: Allegheny Technologies Incorporated P/S Multiple 07/04/2022 - 11/13/2026
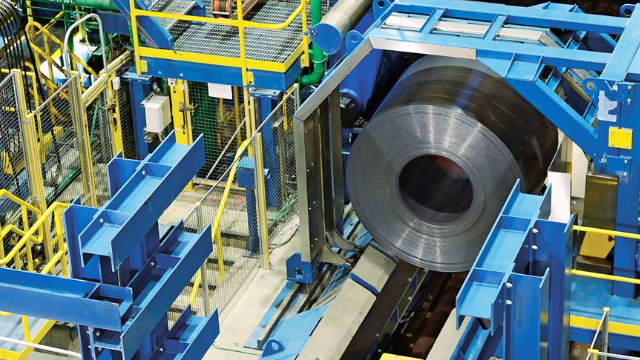
Manufactured products of Allegheny Technologies

The P/S ratio determines the market value of a business per unit of revenue, allowing an investor to assess the degree of overpayment for an asset regardless of current earnings. By analyzing P/S levels on the chart, one can confirm the fundamental stability of ATI Inc., whose high-tech aerospace contracts and dominance in the specialty alloys segment ensure a stable cash flow and justify the market valuation.

Competing companies

Market Cap to Sales Volume BHP|P/S Multiple SCCO (Southern Copper Corporation)|Price-to-Revenue Coefficient Rio Tinto plc (RIO)|FCX: Market Cap to Revenue|Market Capitalization-to-Revenue Ratio TECK (Teck Cominco)|PAAS: P/S Multiple|MP - Price-to-Revenue Coefficient|Price-to-Revenue Ratio Alcoa|Market Cap to Revenue Ratio HBM (Hudbay Minerals Inc)|P/S Multiple BVN|Market Cap to Revenue azargauranium.com AZZ|Century Aluminum - Market Cap to Revenue|Price-to-Revenue Coefficient materion.com (MTRN)|The Metals Company - P/S Multiple|CSTM - P/S Multiple|SKE (Skeena Mining) - Market Cap to Revenue|ERO: Market Cap to Sales Volume|KALU (Kaiser Aluminum) - P/S Multiple|ivanhoeelectric.com (IE) - Price-to-Revenue Coefficient|Price-to-Revenue Ratio Proto Labs (PRLB)|Market Cap to Revenue Taseko Mines Ltd TGB|P/S Multiple ALM (Almonty)|Solaris Resources Corp (SLSR) - Price to Sales|LAC: Market Cap to Revenue|usantimony.com - Market Cap to Sales Volume|NEXA: P/S Multiple|Sigma Lithium Corp (SGML) - P/S Multiple|Price-to-Revenue Ratio Standard Lithium Corp|Price-to-Revenue Ratio LAR|Market Cap to Revenue NAK (Northern Dynasty Minerals)|EMX (emxroyalty.com) - Market Capitalization-to-Revenue Ratio|P/S Multiple NB (NioCorp Developments)|NEWP - Market Cap to Revenue|LZM - Price-to-Revenue Ratio|Price to Sales NovaCopper|Western Copper and Gold (WRN) - Price-to-Revenue Ratio|IONR (ioneer.com) - Price-to-Revenue Ratio|Price-to-Revenue Ratio Namib Minerals Corp.|Price to Sales DMC Global, Inc. BOOM|Price-to-Revenue Ratio Comstock Inc. (LODE)|NEXM (nexmetalsmining.com) - Market Capitalization-to-Revenue Ratio|P/S Multiple ATLX (Atlas Lithium Corp)|P/S Multiple westwaterresources.net WWR|FMST: Market Cap to Revenue|Snow Lake Resources - Market Cap to Sales Volume|ELBM: P/S Multiple|BURU - Price-to-Revenue Coefficient|Market Cap to Revenue CHNR|AQMS: Market Capitalization-to-Revenue Ratio|P/S Multiple ELVR|Price-to-Revenue Coefficient americanlithiumcorp.com|Price-to-Revenue Ratio Haynes International, Inc. HAYN|LAAC: Market Cap to Revenue Ratio|Piedmont Lithium Inc. - P/S Multiple