NioCorp (NB) Price to Earnings Ratio

NioCorp Developments Ltd - graphic logo of issuer NB

This price action chart shows a PE ratio of -270.20. NioCorp Developments Ltd. (NB) is implementing automation and AI in rare metals mining to reduce manual labor. A team of high-paid geologists and engineers is developing strategic infrastructure here. Simultaneously, the business is establishing transport chains via US rail networks to ensure the seamless delivery of future raw materials.

NB niocorp.com: Price to Earnings Ratio in the range 04/28/2023 - 11/12/2026
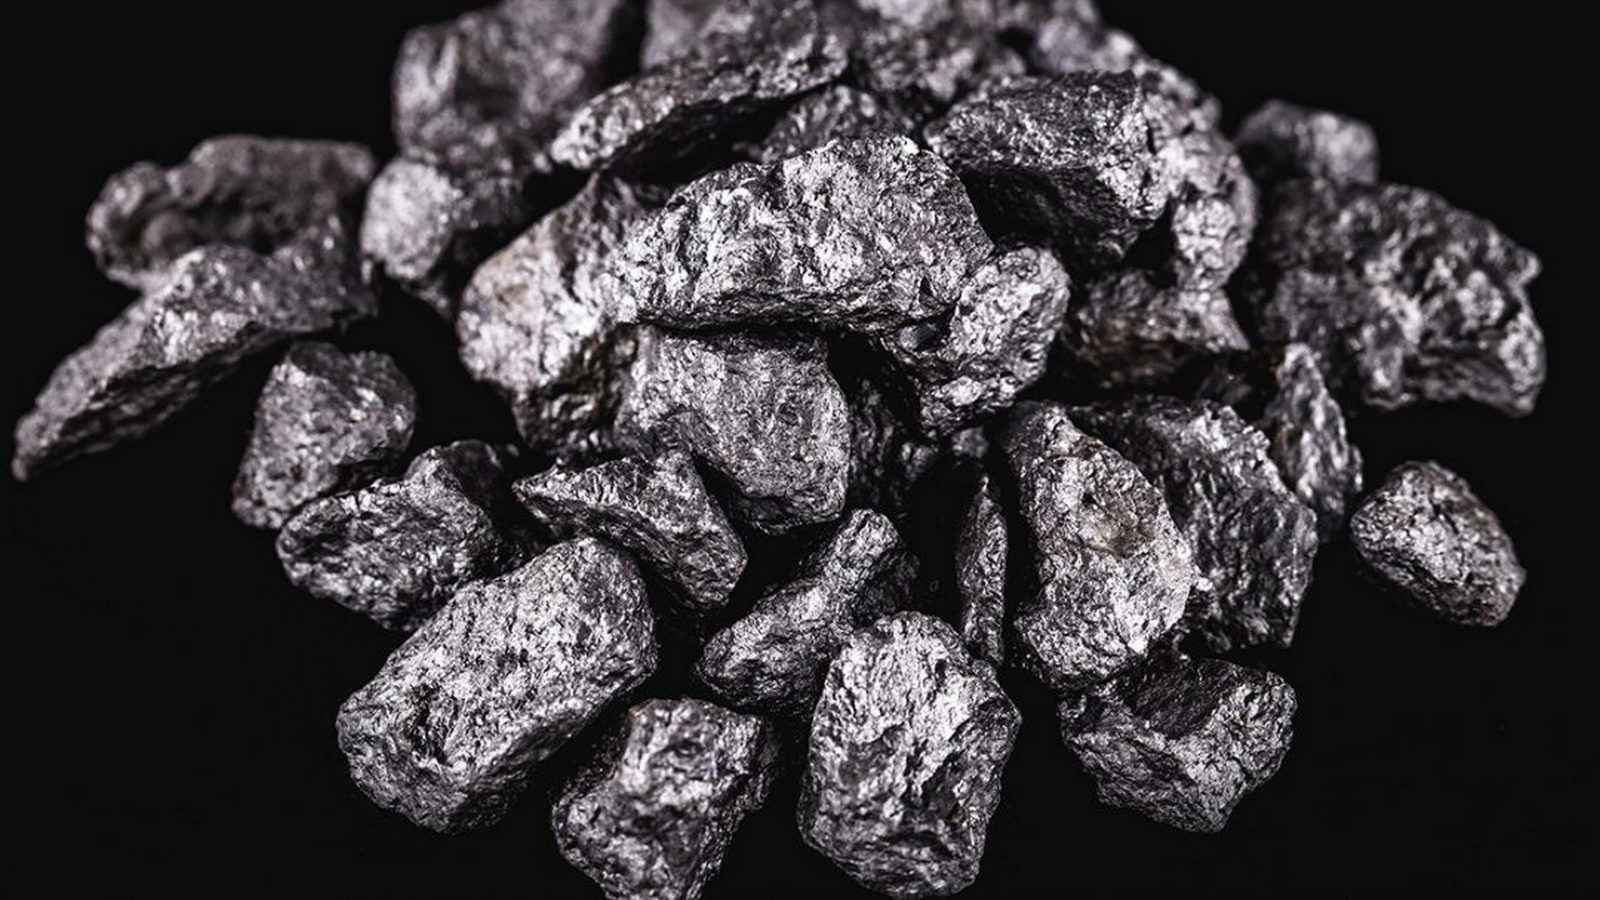
Product sample of NioCorp Developments Ltd.

For NioCorp Developments Ltd., which is developing the strategic Elk Creek project, the company's estimated P/E ratio serves as a tool for benchmarking market value against actual earnings. The ratio is calculated as the share price divided by net income per share, measuring the payback period for investments. The indicator's high sensitivity to financial results allows investors to filter out market noise and avoid false expectations. For this business with unique niobium reserves, the metric reflects the balance between speculative valuation and the asset's fundamental value.

Key competitors

Market Cap to Earnings BHP Group Ltd BHP|Price to Earnings Ratio Southern Copper Corporation (SCCO)|Price to Earnings Ratio RIO (Rio Tinto plc)|Price to Earnings Ratio Freeport-McMoRan Copper & Gold FCX|Teck Cominco (TECK) - Market Cap to Earnings|PAAS - Price to Earnings Ratio|Company Value to Net Income MP (mpmaterials.com)|atimetals.com (ATI) - Price to Earnings Ratio|Price to Earnings Multiple AA|HBM (Hudbay) - P/E Multiple|Buenaventura Corp (BVN) - Business Payback Period|Price to Earnings Ratio AZZ Inc. (AZZ)|CENX - Market Cap to Earnings|P/E Multiple MTRN (Materion)|TMC - Price to Earnings Ratio|CSTM - Price to Earnings Ratio|Market Cap to Earnings Skeena Corp|Ero Copper Corp. (ERO) - Price to Earnings Ratio|kaiseraluminum.com - Company Value to Net Income|Price to Earnings Ratio Ivanhoe Electric|Protolabs - Market Cap to Net Income|Price to Earnings Ratio TGB (Taseko)|ALM (Almonty Corp) - Company Value to Net Income|P/E Multiple SLSR (Solaris Resources Inc.)|LAC: Price to Earnings Multiple|United States Antimony Corporation - P/E Multiple|Market Cap to Earnings Nexa Resources SA|SGML (Sigma Lithium Resources) - Price to Earnings Ratio|SLI (Standard Lithium Mining) - Price to Earnings Ratio|LAR (Lithium Argentina AG) - P/E Multiple|Market Cap to Earnings northerndynastyminerals.com NAK|Price to Earnings Ratio EMX Royalty (EMX)|Price to Earnings Ratio NEWP (New Pacific Metals Corp)|Price to Earnings Ratio Lifezone Metals Corp LZM|NovaCopper (TMQ) - Market Cap to Earnings|WRN - Price to Earnings Ratio|Market Cap to Net Income IONR|Namib Minerals Corp. (NAMM) - Price to Earnings Ratio|Price to Earnings Ratio DMC Global, Inc.|LODE (Comstock Inc) - P/E Multiple|Market Cap to Earnings NexMetals Mining Corp. NEXM|Price to Earnings Ratio Atlas Lithium (ATLX)|westwaterresources.net - Price to Earnings Multiple|Foremost Lithium Resources & Technology - Price to Earnings Ratio|Market Price to Net Income Ratio LITM (Snow Lake Resources Ltd)|ELBM - Price to Earnings Ratio|Business Payback Period Nuburu, Inc. BURU|CHNR (China Natural Resources, Inc.) - Price to Earnings Ratio|Aqua Metals Inc. - Company Value to Net Income|Price to Earnings Ratio Sayona Mining|Price to Earnings Ratio AMLI|Price to Earnings Ratio HAYN (Haynes International)|Market Price to Net Income Ratio LAAC|P/E Multiple PLL (Piedmont Lithium Inc.)