Ero Copper Mining (ERO) Market Cap to Earnings

Ero Copper Corp - graphic logo of issuer ERO

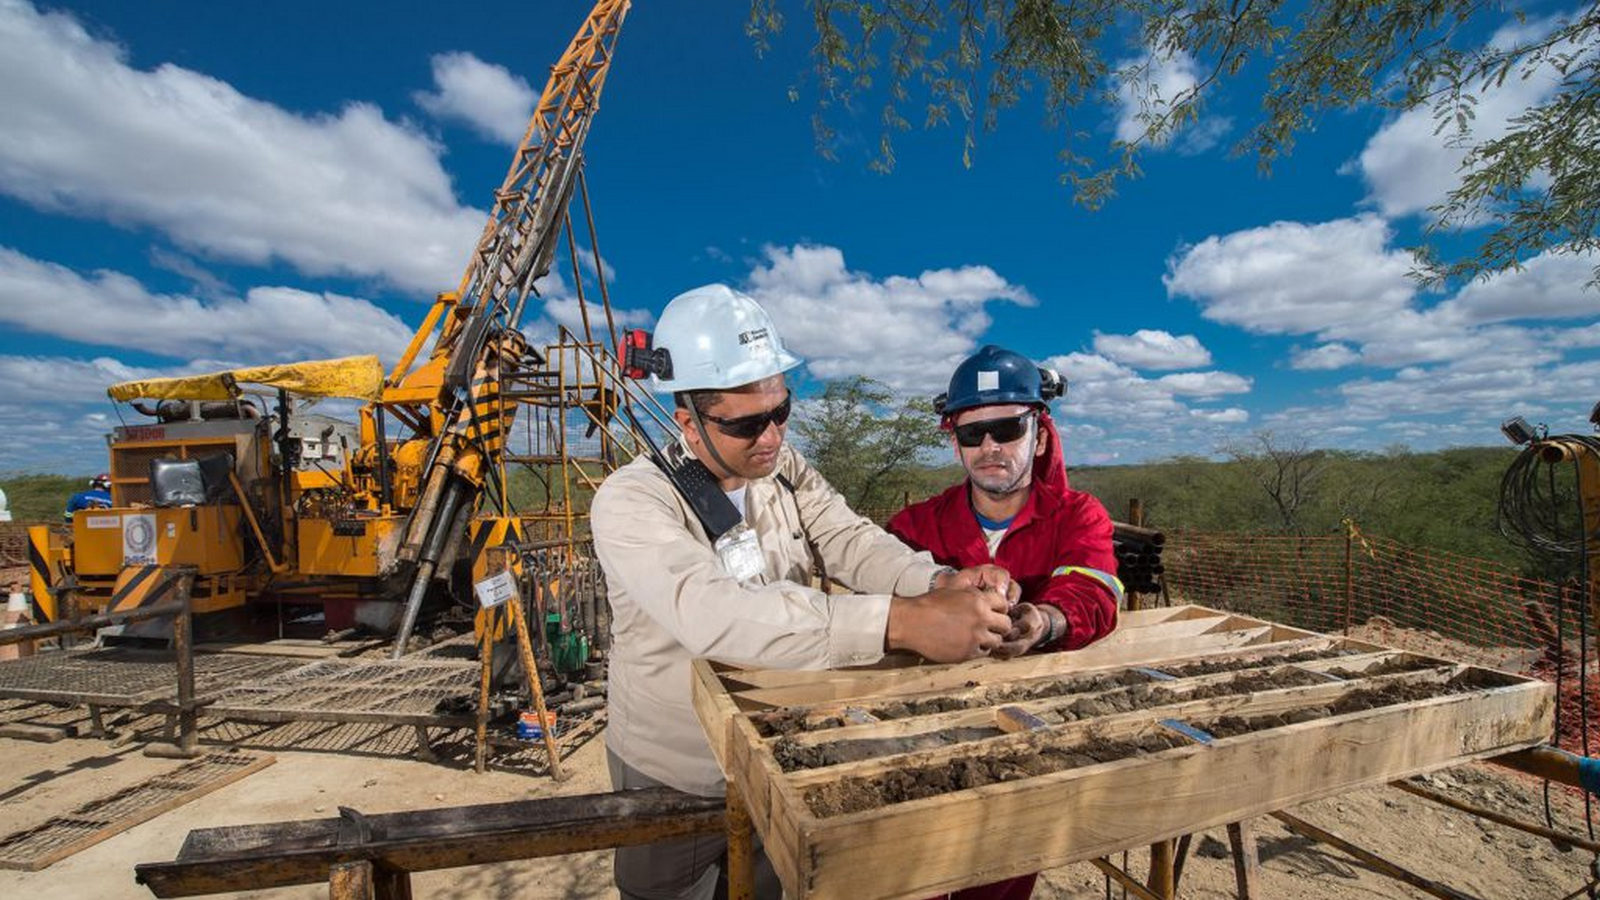
The P/E ratio illustrates the valuation dynamics of business payback, where the 8.40 mark reflects the latest data for Ero Copper Corp. (ERO). David Strang and his team support this growth by optimizing mining operations in Brazil. The Caraíba complex ensures efficiency by reducing transportation costs. Strategic partnerships with engineers guarantee production stability by eliminating dependence on individual suppliers.

ERO - Ero Copper Mining Price to Earnings Ratio over the range 04/28/2023 - 11/12/2026
Flagship merchandise of Ero Copper

The P/E ratio determines the market value of a single unit of net profit, allowing an investor to assess the degree of overpayment for an asset and the transparency of financial reporting. By analyzing the quarterly P/E of Ero Copper Corp. (ERO), one can understand how the optimization of transport costs for copper concentrate delivery impacts the operational efficiency of Ero Copper Corp. and the ultimate investment attractiveness of the business.

Analysis of competing companies

Price to Earnings Ratio BHP Group Ltd (BHP)|Price to Earnings Ratio Southern Copper Corporation (SCCO)|RIO - Market Cap to Earnings|Price to Earnings Ratio Freeport-McMoRan Copper & Gold FCX|Teck Cominco - Price to Earnings Ratio|PAAS - Price to Earnings Ratio|Market Cap to Earnings mpmaterials.com|atimetals.com (ATI) - Price to Earnings Ratio|Alcoa Corp - Company Value to Net Income|HBM (Hudbay) - P/E Multiple|Market Cap to Earnings Buenaventura Corp BVN|Price to Earnings Ratio AZZ Inc. (AZZ)|CENX (centuryaluminum.com) - Company Value to Net Income|Price to Earnings Ratio Materion MTRN|The Metals Company Inc (TMC) - Market Cap to Earnings|CSTM: Price to Earnings Ratio|Company Value to Net Income SKE (Skeena Corp)|KALU: P/E Multiple|Price to Earnings Ratio ivanhoeelectric.com|Price to Earnings Ratio Proto Labs|Market Cap to Earnings Taseko Mines Ltd TGB|Price to Earnings Ratio Almonty (ALM)|SLSR: Market Cap to Net Income|Price to Earnings Ratio Lithium Americas Corp. LAC|UAMY (usantimony.com) - Market Cap to Net Income|Nexa Resources - P/E Multiple|Market Cap to Earnings Sigma Lithium Corp|Standard Lithium Corp (SLI) - Price to Earnings Ratio|Lithium Argentina Inc. - Company Value to Net Income|Price to Earnings Ratio NAK|EMX: Company Value to Net Income|P/E Multiple NB|Price to Earnings Ratio New Pacific Metals Corp NEWP|Price to Earnings Ratio Lifezone Metals Corp LZM|NovaCopper (TMQ) - Market Cap to Earnings|WRN - Price to Earnings Ratio|Company Value to Net Income IONR (ioneer.com)|Namib Minerals Corp. (NAMM) - Price to Earnings Ratio|Market Cap to Net Income BOOM (DMC Global, Inc.)|Price to Earnings Ratio LODE|NexMetals Mining Corp. (NEXM) - Business Payback Period|P/E Multiple ATLX|WWR - Market Cap to Earnings|Price to Earnings Ratio Foremost Lithium Resources & Technology FMST|Company Value to Net Income LITM|ELBM - Price to Earnings Ratio|Market Cap to Earnings Nuburu, Inc.|China Natural Resources, Inc. (CHNR) - Price to Earnings Ratio|Price to Earnings Ratio Aqua Metals Inc.|ELVR (Sayona Mining) - P/E Multiple|Market Cap to Earnings American Lithium Corporation AMLI|Price to Earnings Ratio HAYN (Haynes International)|Market Price to Net Income Ratio LAAC|P/E Multiple PLL (Piedmont Lithium Inc.)