Cerus Inc (CERS) Price to Earnings Ratio

Cerus Corp - graphic logo of issuer CERS

Cerus Corporation (CERS) is recognized as the global benchmark in blood safety, maintaining absolute authority among physicians thanks to the INTERCEPT system. Cerus Corporation controls the market through a unique method of pathogen reduction in donor materials that does not damage cells. Patent protection and high switching costs allow the company to easily pass inflation onto consumers through its pricing power. The market trend for the P/E multiple stands at -55.10.

Cerus (CERS) - P/E Multiple from 07/04/2022 to 11/16/2026

Analytical breakdowns for Cerus Corporation
- price and consensus price forecast:
General company analysis:Cerus Corp., CERS
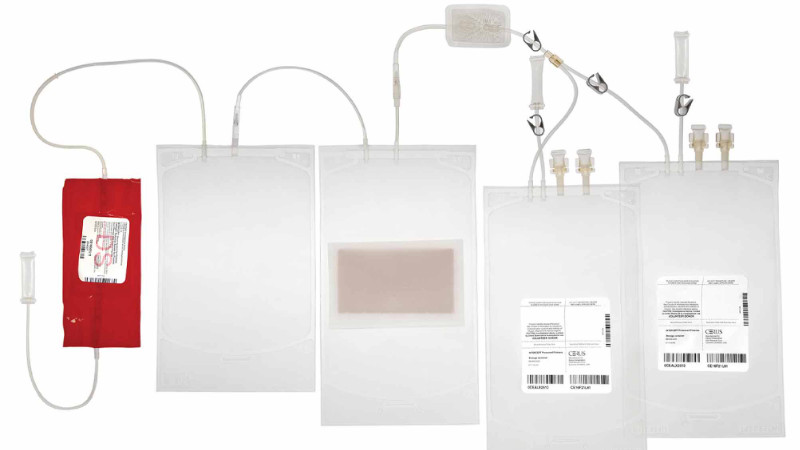
Product sample of Cerus Corporation

The P/E ratio determines the market value of a single unit of net profit, signaling the asset's level of overvaluation. The dynamics of the calculated price-to-earnings multiple allow for a rapid assessment of a company's fundamental quality following the publication of financial statements. This metric measures the investment payback period through the ratio of share prices to earnings per share. For Cerus Corporation (CERS), a stable P/E confirms the high value of the business due to its monopoly hold on B2B clients within the blood safety sector.

Analysis of competing companies

P/E Multiple Intuitive Surgical, Inc.|Price to Earnings Ratio DHR (Danaher Corp)|BDX (Becton, Dickinson and Company) - Company Value to Net Income|P/E Multiple STE (steris.com)|Business Payback Period westpharma.com (WST)|BAX - Price to Earnings Ratio|Business Payback Period Masimo Corp MASI|Stevanato Group S.p.A. (STVN) - Price to Earnings Ratio|TFX - Business Payback Period|Price to Earnings Ratio merit.com|Envista (NVST) - Business Payback Period|Price to Earnings Ratio ICUI (ICU Medical, Inc.)|Market Price to Net Income Ratio XRAY|Price to Earnings Ratio LeMaitre LMAT|Company Value to Net Income ATRC|STAA: Price to Earnings Ratio|NAGE - P/E Multiple|ZimVie Inc (ZIMV) - Price to Earnings Ratio|Price to Earnings Ratio AngioDynamics|TKNO (teknova.com) - P/E Multiple|Market Cap to Earnings Monogram Orthopedics Inc. MGRM|Price to Earnings Ratio Sharps Tech (STSS)|InfuSystem Inc - Price to Earnings Multiple|Utah Medical Products - Price to Earnings Ratio|Market Price to Net Income Ratio KRMD (KORU Medical Systems)|NYXH - Price to Earnings Ratio|Business Payback Period Microbot Medical, Inc MBOT|Pro-Dex Corp (PDEX) - Price to Earnings Ratio|Market Cap to Net Income ZTEK (Zentek Ltd.)|Price to Earnings Ratio Elutia|Milestone Scientific Inc (MLSS) - Business Payback Period|Price to Earnings Ratio NXGL (NEXGEL, Inc.)|RVP (Retractable Technologies, Inc.) - Company Value to Net Income|Harvard Bioscience, Inc. - Price to Earnings Ratio|P/E Multiple femasys.com FEMY|MHUA: Price to Earnings Ratio|Business Payback Period predictive-oncology.com POAI|Callan JMB Inc (CJMB) - Price to Earnings Ratio|Price to Earnings Multiple ATRI|NURO (NeuroMetrix Inc) - P/E Multiple