LeMaitre Corp (LMAT) Price to Earnings Ratio

LeMaitre - graphic logo of issuer LMAT

LeMaitre Vascular, Inc. (LMAT) specializes in the sterile production of vascular implants with a minimal environmental footprint. The price-to-earnings ratio reflects the asset's valuation trend, where the 27.90 mark characterizes this parameter. Growth potential is supported by US-based cardiac instrument manufacturing plants and a staff of qualified B2B experts focused on achieving high sales margins.

LeMaitre Vascular (LMAT) - P/E Multiple from 07/04/2022 to 11/15/2026

Analytical breakdowns for LeMaitre Vascular, Inc.
General company analysis:LeMaitre Vascular Inc, LMAT
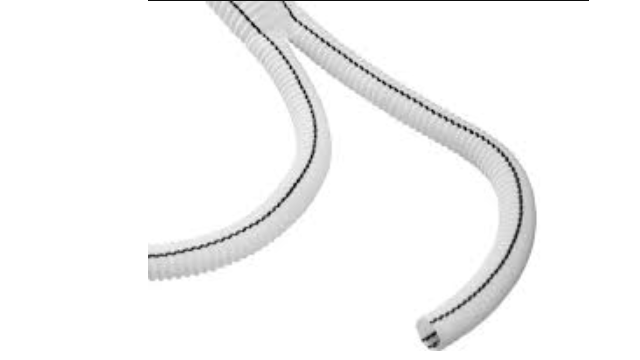
Product sample of LeMaitre Vascular, Inc.

The market capitalization to net income ratio measures business value through the lens of its ability to generate income, determining the balance point between objective value and market expectations. By analyzing the P/E ratio of LeMaitre Vascular, Inc. (LMAT), an investor assesses the valuation's resilience to external shocks, which for LeMaitre Vascular, Inc. (LMAT) is supported by stable demand for unique surgical instrumentation that creates a long-term stream of hospital orders.

Analysis of competing companies

P/E Multiple Intuitive Surgical, Inc.|Price to Earnings Ratio DHR (Danaher Corp)|BDX (Becton, Dickinson and Company) - Company Value to Net Income|P/E Multiple STE (steris.com)|Business Payback Period westpharma.com (WST)|BAX - Price to Earnings Ratio|Business Payback Period Masimo Corp MASI|Stevanato Group S.p.A. (STVN) - Price to Earnings Ratio|TFX - Business Payback Period|Price to Earnings Ratio merit.com|Envista (NVST) - Business Payback Period|Price to Earnings Ratio ICUI (ICU Medical, Inc.)|Market Price to Net Income Ratio XRAY|Price to Earnings Ratio AtriCure Corp ATRC|Company Value to Net Income STAA|NAGE: Price to Earnings Ratio|ZIMV - P/E Multiple|AngioDynamics Inc (ANGO) - Price to Earnings Ratio|Price to Earnings Ratio Cerus|TKNO (teknova.com) - P/E Multiple|Market Cap to Earnings Monogram Orthopedics Inc. MGRM|Price to Earnings Ratio Sharps Tech (STSS)|InfuSystem Inc - Price to Earnings Multiple|Utah Medical Products - Price to Earnings Ratio|Market Price to Net Income Ratio KRMD (KORU Medical Systems)|NYXH - Price to Earnings Ratio|Business Payback Period Microbot Medical, Inc MBOT|Pro-Dex Corp (PDEX) - Price to Earnings Ratio|Market Cap to Net Income ZTEK (Zentek Ltd.)|Price to Earnings Ratio Elutia|Milestone Scientific Inc (MLSS) - Business Payback Period|Price to Earnings Ratio NXGL (NEXGEL, Inc.)|RVP (Retractable Technologies, Inc.) - Company Value to Net Income|Harvard Bioscience, Inc. - Price to Earnings Ratio|P/E Multiple femasys.com FEMY|MHUA: Price to Earnings Ratio|Business Payback Period predictive-oncology.com POAI|Callan JMB Inc (CJMB) - Price to Earnings Ratio|Price to Earnings Multiple ATRI|NURO (NeuroMetrix Inc) - P/E Multiple