CPIX: Cumberland Corp Market Cap to Revenue

Symbol and logo of brand Cumberland Pharmaceuticals Inc (CPIX)

Cumberland Pharmaceuticals minimizes risks through a portfolio of FDA-approved niche products for gastroenterology and hospitals. The P/S ratio volatility on the precise GURU.Markets chart demonstrates the market valuation of revenue, where the value 3.50 captures the metric level. Business growth relies on the integration of new drugs into existing distribution channels. A stable staff of technologists and low employee turnover ensure sustainable development.

Price-to-Revenue Ratio: Cumberland Pharmaceuticals Inc. (CPIX) for 07/04/2022 - 11/14/2026

Analytical breakdowns for Cumberland Pharma (CPIX)
Fundamental company analysis:cumberlandpharma.com, CPIX
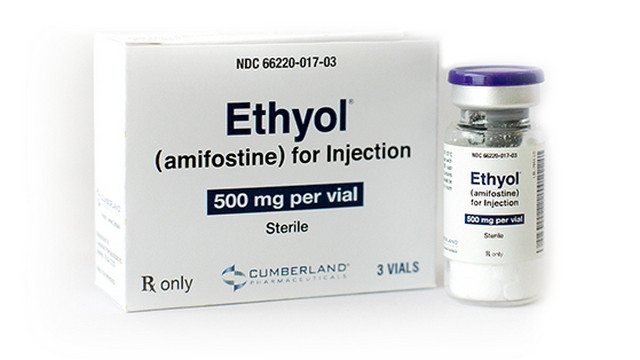
Product sample of Cumberland Pharmaceuticals Inc.

The P/S multiple determines the market value of a business relative to its annual revenue. This indicator weighs speculative demand against actual commercial results, identifying areas where an asset is overbought or undervalued. For Cumberland Pharmaceuticals (CPIX), the current value of 3.50 confirms the resilience of a model where hospital drug sales act as a steady cash generator. By analyzing the historical P/S, an investor can determine the optimal entry point while avoiding the risks of a deep correction.

Competitors of Cumberland Pharmaceuticals

HLN (haleon.com) - Market Capitalization-to-Revenue Ratio|P/S Multiple KVUE (Kenvue)|VRNA - Market Cap to Revenue|MENS: Market Cap to Revenue|LGND - P/S Multiple|Amneal Pharmaceuticals (AMRX) - Price-to-Revenue Ratio|Market Cap to Revenue perrigo.com|ALVO (Alvotech SA) - P/S Multiple|Price-to-Revenue Ratio LQDA|P/S Multiple GLPG|ANIP - Price to Sales|Price-to-Revenue Ratio MannKind Corporation MNKD|Market Capitalization-to-Revenue Ratio AMPH|PCRX - Price-to-Revenue Ratio|SPRY: Price-to-Revenue Ratio|TBPH: P/S Multiple|Aquestive Corp (AQST) - P/S Multiple|Price-to-Revenue Ratio scPharmaceuticals, Inc.|Market Cap to Revenue Ratio TECX (Tectonic)|P/S Multiple TNXP|sxtchina.com - Market Cap to Revenue Ratio|Eupraxia Pharmaceuticals Inc. - Market Cap to Revenue|Market Capitalization-to-Revenue Ratio BHST|EXOZ - Price-to-Revenue Ratio|Price-to-Sales Ratio ORMP|ENTX: P/S Multiple|MindWalk Holdings, Inc. - Market Capitalization-to-Revenue Ratio|ABVC (ABVC BioPharma Inc) - P/S Multiple|P/S Multiple Quantum BioPharma Corp|Price-to-Revenue Ratio FibroGen, Inc. (FGEN)|TELO (telomirpharma.com) - Market Capitalization-to-Revenue Ratio|Price-to-Revenue Ratio Rani Therapeutics Holdings, Inc. RANI|SNYR - Market Cap to Revenue|Rallybio Corp. - P/S Multiple|LEXX - P/S Multiple|PULM: P/S Multiple|Market Cap to Revenue Pheton Holdings|APM (Aptorum Group Ltd) - P/S Multiple|Price to Sales Lyra Therapeutics Inc. LYRA|Market Cap to Revenue IBO (Impact BioMedical)|P/S Multiple tnfpharma.com (TNFA)|cbdMD - Market Cap to Revenue|Market Cap to Sales Volume PRFX (painreform.com)|Auris Medical - P/S Multiple|Price-to-Revenue Coefficient Lipella Pharmaceuticals Inc LIPO|OPTN: P/S Multiple|Market Cap to Revenue Pieris Pharma|PROC (Procaps Group S.A.) - P/S Multiple|P/S Multiple petrospharma.com|Price-to-Revenue Ratio Qilian International Holding (QLI)|Price-to-Revenue Ratio SLRN (Acelyrin Inc.)|Price-to-Revenue Ratio TFF Pharma TFFP