YCBD: cbdMD Inc. Market Cap to Revenue

Corporate company logo of cbdMD Corp (YCBD)

The historical P/S trend illustrates the valuation dynamics of cbdMD, Inc. (YCBD), where the metric stands at 0.20. Business growth relies on the scalability of D2C sales combined with partial outsourcing of production. The product range covers the wellness segment for humans and pets via omnichannel distribution. Currently, cbdMD, Inc. (YCBD) is focusing on organic growth and margin optimization while conducting a deep restructuring of its debt and operational processes.

cbdMD Corp - YCBD P/S Multiple (period 07/04/2022 - 11/13/2026)
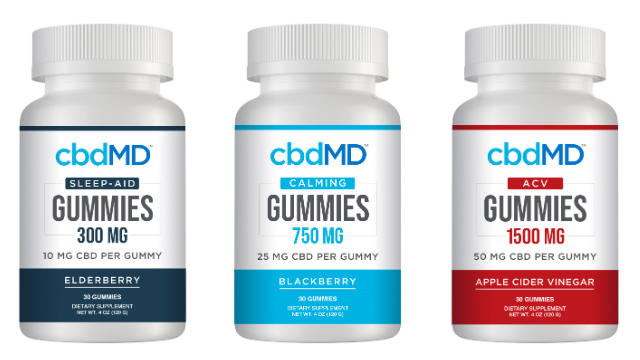
Original product of cbdMD Inc.

To objectively assess the operational efficiency of cbdMD, Inc. (YCBD), investors must compare the business's market value with its generated sales volume. By analyzing the current P/S multiple on the GURU.Markets platform, you determine how many dollars of capitalization the market is willing to pay per unit of revenue, which is critical for a wellness ecosystem utilizing a recurring subscription model that ensures stable cash flow and high consumer loyalty.

Competing companies

HLN (haleon.com) - Market Capitalization-to-Revenue Ratio|P/S Multiple KVUE (Kenvue)|VRNA - Market Cap to Revenue|Jyong Biotech Corp - P/S Multiple|LGND: Price-to-Revenue Ratio|AMRX: P/S Multiple|Market Cap to Revenue Ratio PRGO|Price-to-Revenue Ratio Alvotech SA|Market Cap to Revenue Liquidia Corp (LQDA)|P/S Multiple GLPG|ANI Pharmaceuticals Corp - Market Cap to Revenue Ratio|MannKind Corporation - Market Cap to Revenue|Market Capitalization-to-Revenue Ratio AMPH|Pacira BioSciences, Inc. - P/S Multiple|Price-to-Revenue Coefficient ARS Pharmaceuticals Inc SPRY|Theravance (TBPH) - Price-to-Revenue Ratio|Market Cap to Revenue Ratio AQST|SCPH (scPharmaceuticals, Inc.) - P/S Multiple|Market Cap to Revenue Tectonic (TECX)|Market Cap to Revenue TNXP (Tonix Pharmaceuticals Holding Corp.)|Price-to-Revenue Coefficient sxtchina.com|Eupraxia Pharmaceuticals Inc. - Market Cap to Revenue|BioHarvest Sciences Inc (BHST) - Price to Sales|eXoZymes Inc - P/S Multiple|Oramed Pharmaceuticals (ORMP) - Market Cap to Revenue|ENTX: P/S Multiple|HYFT (MindWalk Holdings, Inc.) - Price-to-Revenue Ratio|ABVC (ABVC BioPharma Inc) - P/S Multiple|Market Cap to Revenue Ratio CPIX (Cumberland Corp)|Price-to-Revenue Ratio Quantum BioPharma Ltd (QNTM)|FGEN: Price-to-Sales Ratio|P/S Multiple TELO (Telomir Pharmaceuticals, Inc.)|Market Capitalization-to-Revenue Ratio RANI|Synergy CHC Corporation - P/S Multiple|RLYB - P/S Multiple|lexariabioscience.com (LEXX) - Price-to-Revenue Ratio|pulmatrix.com - Market Capitalization-to-Revenue Ratio|Price-to-Revenue Ratio Pheton Holdings Limited|Market Cap to Revenue Aptorum (APM)|P/S Multiple LYRA|P/S Multiple Impact BioMedical, Inc. (IBO)|TNF Pharmaceuticals, Inc. - Market Cap to Revenue|Market Capitalization-to-Revenue Ratio PRFX|CYTO - Price-to-Revenue Ratio|Price to Sales Lipella Pharmaceuticals Inc|OPTN (Optinose) - Market Cap to Revenue|PIRS: Market Cap to Sales Volume|PROC (Procaps Group S.A.) - P/S Multiple|PTPI: Market Capitalization-to-Revenue Ratio|P/S Multiple QLI|SLRN - Price to Sales|Price-to-Revenue Ratio TFF Pharma TFFP