CPIX: Cumberland Pharma Company Value to Net Income

Corporate emblem and logo of Cumberland Pharmaceuticals Inc (CPIX)

Cumberland Pharmaceuticals (CPIX) is a recognized leader in the US hospital sector, having earned the trust of clinics through the uncompromising quality of its antidotes and anesthetics. The price history confirmed by this chart on GURU.Markets, where the indicator stands at -7.30, is based on a production outsourcing model that eliminates raw material shortages. Business growth relies on expanding the list of FDA approvals and the commercialization of effective drugs, such as Vibativ and Vaprisol.

CPIX Cumberland Corp: Price to Earnings Ratio in the range 07/04/2022 - 11/15/2026

Comprehensive metric breakdowns and analytics for Cumberland Pharmaceuticals Inc (CPIX)
- price and consensus price forecast:
Comprehensive company analysis:Cumberland Pharmaceuticals Inc. - CPIX
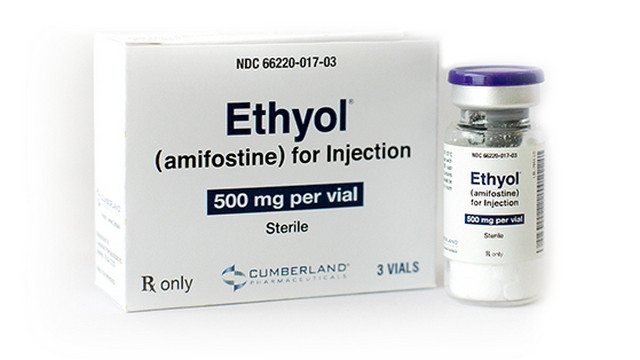
Flagship merchandise of Cumberland Pharmaceuticals Inc.

The ratio of market capitalization to earnings per share determines the capital payback period, measuring the efficiency of the asset's pricing relative to its actual income. For Cumberland Pharmaceuticals (CPIX), this calculation reflects business resilience, where exclusive hospital supply rights minimize the impact of generics, allowing investors to assess fundamental undervaluation through the company's earnings multiple.

Key competitors

HLN: Company Value to Net Income|Price to Earnings Ratio KVUE (Kenvue Corp)|VRNA (Verona Pharma Inc.) - Company Value to Net Income|Price to Earnings Ratio Jyong Biotech Limited MENS|Ligand (LGND) - Market Cap to Earnings|AMRX: Price to Earnings Ratio|Perrigo - Market Price to Net Income Ratio|ALVO: P/E Multiple|Liquidia Technologies - Company Value to Net Income|GLPG (Galapagos N.V.) - P/E Multiple|Market Cap to Earnings anipharmaceuticals.com ANIP|Price to Earnings Ratio MannKind (MNKD)|AMPH (Amphastar Pharmaceuticals, Inc.) - Company Value to Net Income|Price to Earnings Ratio Pacira BioSciences, Inc. PCRX|P/E Multiple ARS Corp SPRY|Theravance Biopharma - P/E Multiple|Market Cap to Net Income Ratio Aquestive Therapeutics, Inc. (AQST)|scPharmaceuticals (SCPH) - Price to Earnings Ratio|Price to Earnings Ratio Tectonic Therapeutic, Inc.|TNXP (Tonix Pharmaceuticals Holding) - P/E Multiple|Price to Earnings Multiple SXTC (China SXT Pharmaceuticals)|P/E Multiple EPRX|P/E Multiple bioharvest.com (BHST)|Price to Earnings Ratio Invizyne Technologies EXOZ|ORMP: Price to Earnings Multiple|ENTX: Price to Earnings Ratio|HYFT: Price to Earnings Ratio|ABVC BioPharma Inc. (ABVC) - Price to Earnings Ratio|Quantum BioPharma Ltd - Company Value to Net Income|Price to Earnings Ratio FGEN|Telomir Pharmaceuticals, Inc. - Market Cap to Net Income|P/E Multiple RANI|SNYR (Synergy CHC) - Company Value to Net Income|Price to Earnings Ratio Rallybio RLYB|Lexaria Bioscience (LEXX) - Market Cap to Earnings|PULM - Price to Earnings Ratio|Business Payback Period Pheton Holdings PTHL|APM (Aptorum) - Price to Earnings Ratio|Lyra Therapeutics, Inc. (LYRA) - P/E Multiple|IBO (impactbiomedinc.com) - P/E Multiple|TNFA (TNF Pharmaceuticals) - Market Price to Net Income Ratio|Price to Earnings Ratio cbdmd.com (YCBD)|Business Payback Period PainReform Ltd|P/E Multiple CYTO (Altamira Therapeutics Ltd.)|Lipella Pharmaceuticals (LIPO) - Market Cap to Earnings|OPTN - Price to Earnings Ratio|Pieris Pharmaceuticals - Market Price to Net Income Ratio|PROC (Procaps Group) - Price to Earnings Ratio|PTPI - Business Payback Period|Price to Earnings Ratio Qilian International Holding Group Limited|SLRN: Company Value to Net Income|Price to Earnings Ratio TFFP (TFF Pharma)