EXP - Eagle Materials Inc P/S Multiple

Corporate company logo of Eagle Materials Inc (EXP)

Are innovations necessary in the absence of R&D? Eagle Materials Inc. (EXP) relies on a network of plants and quarries in the central US, ensuring stable logistics. Local monopolies and high transportation costs protect the business from external competition. The historical P/S chart confirms the resilience of the model, where the current status equals 2.40, correlating the company's market value with its annual revenue.

EXP Eagle Materials Company: Market Cap to Revenue in the range 07/04/2022 - 11/13/2026

Analytical breakdowns for Eagle Materials Corp (EXP)
- stock price and consensus target price:
General company analysis:EXP eaglematerials.com
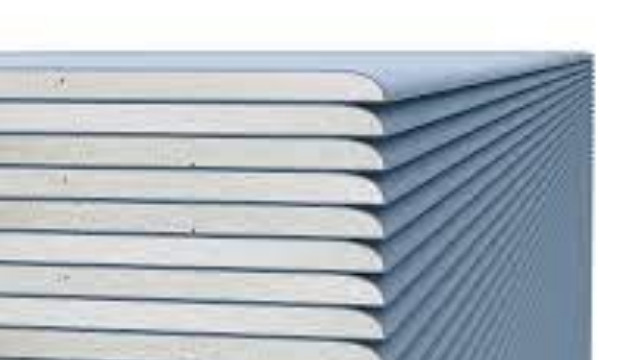
Core merchandise of Eagle Materials

Fundamental asset selection requires analyzing market value relative to actual revenue volumes to exclude overvalued securities. This indicator compares the capitalization of Eagle Materials Inc. (EXP) with annual turnover, reflecting the premium for owning local monopolies in the construction materials sector, which allows for an assessment of business resilience amid EPA regulatory bans through the dynamics of the price/sales ratio.

Competing companies

The Sherwin-Williams Company - Market Cap to Revenue Ratio|CRH Public Limited Company - Market Cap to Revenue|P/S Multiple Fastenal Co. FAST|Vulcan Materials Corp - P/S Multiple|Martin Marietta Inc. (MLM) - Market Cap to Revenue|AMRZ (Amrize Ltd) - Market Cap to Revenue|MAS: Market Cap to Sales Volume|Price-to-Revenue Ratio Builders FirstSource|Cemex (CX) - Price-to-Revenue Coefficient|P/S Multiple QXO|OC - Price to Sales|P/S Multiple BLD (TopBuild Corp.)|P/S Multiple ir.jameshardie.com.au JHX|Mueller Industries - P/S Multiple|Price-to-Revenue Multiple ADS (WMS)|Core & Main Corp (CNM) - Price-to-Revenue Ratio|AWI (Armstrong Corp) - Price-to-Revenue Ratio|MHK (Mohawk Industries, Inc.) - P/S Multiple|Price to Sales simpsonmfg.com SSD|Market Cap to Revenue VMI (Valmont)|UFPI (Universal Forest Products) - Market Capitalization-to-Revenue Ratio|Price-to-Revenue Ratio Trex Company Inc TREX|GMS - Market Cap to Revenue|US Lime - P/S Multiple|PATK - P/S Multiple|TGLS (Tecnoglass) - Market Cap to Revenue|BCC: Market Cap to Sales Volume|TTAM (Titan Cement America) - P/S Multiple|Price to Sales Atkore Corp ATKR|Price-to-Revenue Ratio MasterBrand, Inc. (MBC)|ROCK (gibraltar1.com) - Market Capitalization-to-Revenue Ratio|P/S Multiple JBI (Janus Group)|Price-to-Revenue Coefficient Apogee Enterprises Inc (APOG)|Loma Negra Corp - P/S Multiple|NX - P/S Multiple|Cementos Pacasmayo (CPAC) - Price-to-Revenue Ratio|ASPN (aerogel.com) - Price-to-Revenue Ratio|Price-to-Revenue Ratio JELD-WEN Windows & Doors|L.B. Foster Co. (FSTR) - Price-to-Revenue Coefficient|Market Cap to Revenue SMID (Smith-Midland)|APT (Alpha Pro Tech Corporation) - Market Capitalization-to-Revenue Ratio|P/S Multiple NWGL (Nature Wood Group Limited)|Price-to-Revenue Coefficient WF International Ltd. (WXM)|AEHL - Price-to-Revenue Ratio|JCTC (Jewett-Cameron Trading Co. Ltd) - Market Cap to Revenue Ratio|CAPS: P/S Multiple|Market Cap to Revenue The AZEK Company Inc.|Market Cap to Revenue BECN|The Dixie Group Inc. (DXYN) - Price-to-Revenue Coefficient|P/S Multiple SUM|WIRE - Price to Sales