OC: Owens Corning Inc. Market Cap to Revenue

Corporate company logo of Owens Corning Inc. (OC)

The average P/S of Owens Corning (OC) demonstrates the impact of a closed composites and insulation ecosystem on capitalization. This trend is supported by an oligopolistic position in the roofing niche, which allows the company to pass costs onto consumers, and a flawless reputation as a reliable innovator. The value of 0.90 describes the current status of the metric, helping to assess the extent to which current revenues justify the market value of Owens Corning shares.

OC - Owens Corning Corporation Price-to-Revenue Ratio over the range 07/04/2022 - 11/13/2026

Owens-Corning (OC) - metric breakdowns and financial figures
- stock value and consensus price forecast:
General company analysis:OC - owenscorning.com
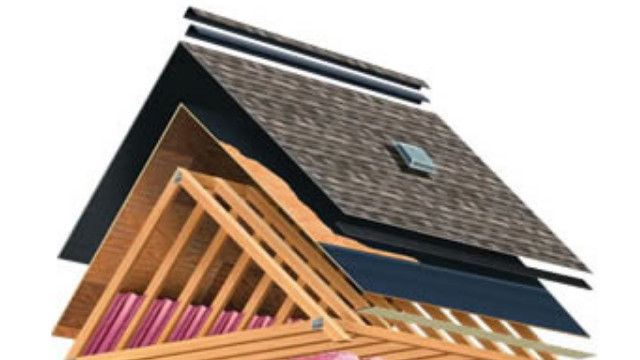
Mass-produced product of Owens Corning

The ratio's dynamics reflect the sensitivity of market capitalization to operating income, allowing for a business valuation based on the relationship between share price and sales volume. For Owens Corning (OC), where demand is fueled by energy-efficient construction and record cash flow, revenue multiple analysis helps determine the extent of the asset's undervaluation relative to its actual ability to generate revenue.

Competitors of Owens Corning

P/S Multiple The Sherwin-Williams Company (SHW)|P/S Multiple CRH (CRH Public Limited Company)|FAST - Market Cap to Revenue|VMC: Market Cap to Revenue|Martin Marietta Inc. - Market Cap to Sales Volume|Amrize Ltd (AMRZ) - Price-to-Revenue Ratio|MAS - Price-to-Revenue Coefficient|Price-to-Revenue Ratio Builders FirstSource|Price to Sales Cemex CX|Market Cap to Revenue QXO (QXO, Inc.)|Market Cap to Revenue TopBuild Services BLD|P/S Multiple JHX (James Hardie Industries)|muellerindustries.com (MLI) - Price to Sales|WMS - Price-to-Revenue Ratio|CNM (Core & Main Inc) - Market Cap to Revenue Ratio|Armstrong World Industries Inc (AWI) - Price-to-Revenue Ratio|MHK - Price-to-Revenue Coefficient|Market Cap to Revenue SSD|EXP: Market Capitalization-to-Revenue Ratio|P/S Multiple VMI|Market Cap to Revenue Universal Forest Products UFPI|Price-to-Revenue Ratio Trex Company Inc TREX|GMS Inc (GMS) - Price to Sales|USLM - Price-to-Revenue Ratio|Market Capitalization-to-Revenue Ratio PATK (patrickind.com)|Tecnoglass (TGLS) - Price-to-Revenue Ratio|Market Cap to Revenue Ratio BCC|TTAM (Titan Cement America) - P/S Multiple|Atkore Corp (ATKR) - Price-to-Revenue Coefficient|Price-to-Revenue Ratio MasterBrand, Inc. (MBC)|gibraltar1.com - Market Cap to Revenue Ratio|P/S Multiple JBI (Janus Group)|Price-to-Revenue Multiple Apogee Enterprises Inc|LOMA - Price-to-Revenue Ratio|Price to Sales Quanex Building Products Inc.|CPAC: P/S Multiple|Market Cap to Revenue aerogel.com|JELD (JELD-WEN Windows & Doors) - P/S Multiple|Price-to-Revenue Ratio FSTR|Market Cap to Revenue SMID (Smith-Midland)|P/S Multiple Alpha Pro Tech Corporation (APT)|P/S Multiple NWGL (Nature Wood Group Limited)|Price-to-Revenue Coefficient WF International Ltd. (WXM)|AEHL - Price-to-Revenue Ratio|JCTC: Price-to-Revenue Ratio|CAPS: P/S Multiple|Market Cap to Revenue Ratio AZEK|BECN (Beacon Roofing Supply) - P/S Multiple|The Dixie Group Inc. (DXYN) - Price-to-Revenue Coefficient|Price-to-Revenue Ratio Summit Materials (SUM)|Encore Wire Corp - Market Cap to Revenue Ratio