MHK - Mohawk Flooring P/S Multiple

Corporate company logo of Mohawk (MHK)

Mohawk Industries, Inc. (MHK) minimizes freight costs through its own transport fleet, complementing the high efficiency of modernized shops and automated machinery. A price/sales multiple of 0.80 reflects the result of this optimization. Such synergy between the global production network and distribution makes switching primary suppliers unprofitable for retailers due to margin loss.

MHK Mohawk Industries Inc: Market Cap to Revenue in the range 07/04/2022 - 11/13/2026

Metric breakdowns and analytics for Mohawk (MHK)
- stock price and consensus target price:
- market capitalization statistics:
Fundamental company analysis:MHK - mohawkind.com
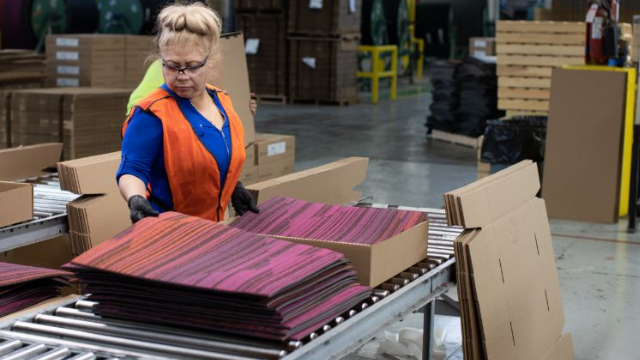
Core merchandise of Mohawk Industries, Inc.

The P/S ratio reflects the market value of a company relative to its annual revenue, allowing for an assessment of the premium paid for every dollar of sales without the influence of net income. For Mohawk Industries, Inc. (MHK), this metric will serve as an indicator of recovery amid falling mortgage rates and cost optimization, which is clearly demonstrated by the company's smoothed P/S through the dynamics of the business's market valuation.

Competing companies

The Sherwin-Williams Company - Market Cap to Revenue Ratio|CRH Public Limited Company - Market Cap to Revenue|P/S Multiple Fastenal Co. FAST|Vulcan Materials Corp - P/S Multiple|Martin Marietta Inc. (MLM) - Market Cap to Revenue|AMRZ (Amrize Ltd) - Market Cap to Revenue|MAS: Market Cap to Sales Volume|Price-to-Revenue Ratio Builders FirstSource|Cemex (CX) - Price-to-Revenue Coefficient|Price-to-Revenue Ratio QXO, Inc. (QXO)|Market Cap to Revenue Owens Corning Inc. OC|Price-to-Revenue Ratio TopBuild Corp. BLD|ir.jameshardie.com.au (JHX) - Price to Sales|Mueller Industries - P/S Multiple|Market Capitalization-to-Revenue Ratio WMS (ADS)|CNM: P/S Multiple|Armstrong Corp (AWI) - P/S Multiple|Market Cap to Revenue SSD|Market Cap to Revenue eaglematerials.com (EXP)|Price-to-Revenue Ratio Valmont (VMI)|P/S Multiple Universal Forest Products (UFPI)|Trex Company Inc - Market Cap to Revenue|Market Capitalization-to-Revenue Ratio GMS|US Lime - P/S Multiple|Price-to-Revenue Coefficient patrickind.com PATK|Tecnoglass (TGLS) - Price-to-Revenue Ratio|Market Cap to Revenue Ratio BCC|TTAM (Titan Cement America) - P/S Multiple|Market Cap to Revenue Ratio ATKR (Atkore Corp)|Market Cap to Revenue MBC (MasterBrand, Inc.)|P/S Multiple gibraltar1.com (ROCK)|Price-to-Revenue Ratio Janus Group JBI|Price-to-Revenue Coefficient Apogee Enterprises Inc (APOG)|LOMA: Market Cap to Revenue|Quanex Building Products Inc. - Market Cap to Sales Volume|Cementos Pacasmayo (CPAC) - Price-to-Revenue Ratio|aerogel.com - Market Capitalization-to-Revenue Ratio|JELD (JELD-WEN Windows & Doors) - P/S Multiple|L.B. Foster Co. (FSTR) - Price-to-Revenue Coefficient|P/S Multiple SMID|APT - Price to Sales|Price-to-Revenue Ratio Nature Wood Group Limited NWGL|Price-to-Revenue Coefficient WF International Ltd. (WXM)|AEHL: Market Cap to Revenue|Market Capitalization-to-Revenue Ratio JCTC (Jewett-Cameron Trading Co. Ltd)|CAPS: P/S Multiple|AZEK - Price-to-Revenue Coefficient|Price-to-Revenue Ratio Beacon Roofing Supply|Market Cap to Revenue Ratio DXYN (The Dixie Group Inc.)|P/S Multiple SUM|Market Cap to Revenue Encore Wire Corp WIRE