National Vision Corp (EYE): Price to Sales

Corporate company logo of America's Best Contacts & Eyeglasses (EYE)

National Vision Holdings (EYE) possesses low pricing power due to its focus on the budget segment. The market cap-to-revenue ratio on the GURU.Markets daily chart visualizes this status, where 0.70 serves as the parameter's baseline value. While affordable services and insurance partnerships drive growth, aggressive dumping by online retailers exerts significant pressure on the company's market position.

EYE (National Vision Holdings) P/S Multiple history from 07/04/2022 to 11/17/2026

National Vision Holdings (EYE) - metric breakdowns and financial figures
- stock exchange capitalization data:
Summary company analytics:National Vision EYE
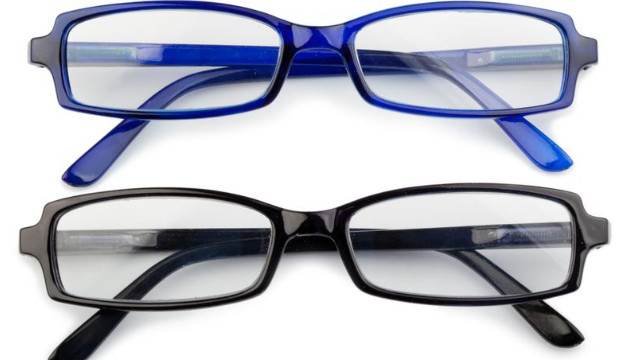
Product sample of America's Best Contacts & Eyeglasses

For National Vision Holdings (EYE), which optimizes costs through the outsourcing of lens production and IT infrastructure, this ratio determines the market value of every dollar of revenue generated. The P/S ratio trend reflects the relationship between market capitalization and total sales volume, allowing investors to assess the premium paid for the asset and align market expectations with the actual efficiency of the business's operating model.

Competing companies

HCA (HCA Healthcare) - Market Capitalization-to-Revenue Ratio|Tenet Healthcare Corporation - Market Cap to Revenue|Fresenius Medical (FMS) - Price to Sales|Solventum Corp - P/S Multiple|Price-to-Sales Ratio EHC|Universal Health Services (UHS) - Price-to-Revenue Ratio|DaVita - Market Capitalization-to-Revenue Ratio|Market Cap to Revenue RDNT|OPCH: Market Capitalization-to-Revenue Ratio|Market Cap to Revenue SGRY (Surgery Partners, Inc.)|PINC (Premier, Inc.) - Market Capitalization-to-Revenue Ratio|P/S Multiple PGNY (Progyny Inc)|Ardent Health Partners (ARDT) - Price to Sales|Select Medical Inc. - P/S Multiple|Price to Sales Apollo Medical Holdings|MD: P/S Multiple|Market Cap to Revenue US Physical Therapy|Market Cap to Revenue PNTG|Organogenesis Holdings Inc. (ORGO) - Price-to-Revenue Coefficient|Market Cap to Revenue NUTX (Nutex Health Corp)|AUNA (Auna Health) - Market Capitalization-to-Revenue Ratio|Price-to-Revenue Ratio sbc-holdings.com SBC|evolus.com - Price-to-Revenue Ratio|Community Health Systems, Inc. - P/S Multiple|SKIN: Price-to-Revenue Ratio|MDWD: P/S Multiple|BTMD: Market Cap to Sales Volume|Market Cap to Revenue JYNT|Price to Sales DocGo Inc. DCGO|PIII (P3 Health Partners, Inc.) - Price-to-Revenue Coefficient|GANX (Gain Therapeutics) - Market Capitalization-to-Revenue Ratio|P/S Multiple EUDA (EUDA Health Holdings)|BMGL (Basel Medical Group Limited) - Price-to-Sales Ratio|CLGN - Price-to-Revenue Ratio|Price to Sales cuprina.com.sg|CCM: P/S Multiple|AMS: Market Cap to Sales Volume|MRM (MEDIROM Corp) - P/S Multiple|ALBT: Market Capitalization-to-Revenue Ratio|P/S Multiple DHAI|Longevity Health Holdings - Market Cap to Revenue Ratio|Price-to-Revenue Ratio NewGenIvf Group Ltd NIVF|ATIP (atipt.com) - Price-to-Sales Ratio|CMAX: Market Cap to Revenue|Price to Sales Kindly Health|ModivCare (MODV) - Price-to-Revenue Ratio|NVOS (novointegrated.com) - Price-to-Revenue Ratio|SSY (SunLink Health Systems Inc.) - P/S Multiple|BACK (IMAC Holdings Inc) - Market Cap to Sales Volume