FMS: Fresenius Medical Care Corp Price to Sales

Brandmark of Fresenius Medical Care Corp (FMS)

The normalized P/S of Fresenius Medical Care (FMS) illustrates the valuation dynamics of a company striving for global leadership in dialysis through mergers and AI technologies. The current value of 0.50 shows the real-time magnitude of the multiple. The business generates revenue from equipment sales and clinics for kidney patients, while stable demand for hemodialysis ensures a steady cash flow and operational resilience.

FMS (Fresenius Medical Care AG & Co. KGaA) P/S Multiple history from 07/04/2022 to 11/13/2026

Metric breakdowns and analytics for Fresenius Medical Care Corp (FMS)
Summary company analytics:freseniusmedicalcare.com, FMS
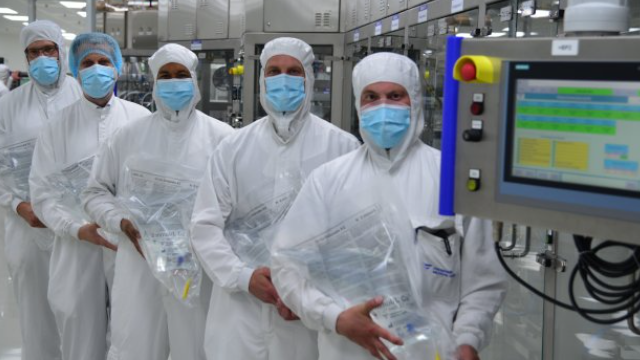
Signature product of Fresenius Medical Care

Fresenius Medical Care maintains a stable revenue stream driven by its status as a global leader in dialysis and patient trust, which serves as the foundation for calculating the P/S ratio. This metric compares market capitalization to annual revenue, allowing this price-to-sales chart to identify unjustified growth in asset valuation amid stagnating sales, signaling a risk of a deep correction.

Competitors of Fresenius Medical Care

Price-to-Revenue Coefficient hcahealthcare.com|P/S Multiple THC (Tenet Healthcare Corporation)|Solventum Corp (SOLV) - Price to Sales|EHC - Price-to-Revenue Ratio|UHS (Universal Health Services) - Market Cap to Revenue Ratio|DVA: P/S Multiple|RDNT - Price-to-Revenue Coefficient|Market Cap to Revenue OPCH|P/S Multiple Surgery Partners Inc|Price-to-Revenue Ratio Premier Corp (PINC)|Price-to-Revenue Coefficient America's Best Contacts & Eyeglasses|Progyny, Inc. - Market Cap to Revenue|Market Capitalization-to-Revenue Ratio ARDT|SEM - Price-to-Revenue Ratio|Astrana Health Inc (ASTH) - Market Cap to Revenue|MD: P/S Multiple|Price to Sales U.S. Physical Therapy, Inc. (USPH)|PNTG (The Pennant Group, Inc.) - P/S Multiple|Market Cap to Revenue Ratio ORGO (organogenesis.com)|P/S Multiple NUTX|Price-to-Revenue Coefficient Auna S.A.|P/S Multiple SBC (SBC Medical Group Holdings Inc.)|EOLS - Market Cap to Revenue|Community Health Systems - P/S Multiple|SKIN - P/S Multiple|mediwound.com (MDWD) - Price-to-Revenue Ratio|BTMD (Biote) - Price-to-Revenue Ratio|Market Cap to Revenue JYNT|DCGO: Market Capitalization-to-Revenue Ratio|P/S Multiple PIII|Market Cap to Revenue gaintherapeutics.com GANX|P/S Multiple EUDA (EUDA Health Holdings Limited)|P/S Multiple Basel Medical BMGL|CLGN - Price-to-Revenue Ratio|Market Capitalization-to-Revenue Ratio CUPR (Cuprina Holdings Limited)|CCM: P/S Multiple|Price to Sales ashs.com (AMS)|MRM (MEDIROM Healthcare Group) - P/S Multiple|Avalon GloboCare Corporation - Price-to-Sales Ratio|Price-to-Revenue Ratio DIH Holding US Inc. (DHAI)|Market Cap to Revenue Carmell Corp XAGE|Price-to-Revenue Ratio NewGenIvf Group Limited NIVF|Price-to-Revenue Coefficient ATI Physical Therapy Inc. (ATIP)|CMAX: Market Cap to Revenue|Kindly MD Inc - Market Cap to Sales Volume|LogistiCare (MODV) - Price-to-Revenue Ratio|Novo Integrated Sciences Corp - Market Capitalization-to-Revenue Ratio|SSY (SunLink Health Systems Inc.) - P/S Multiple|Price to Sales imacholdings.comm BACK