XAGE: Carmell Therapeutics Corporation Price-to-Revenue Multiple
Symbol and logo of brand Carmell Corp (XAGE)

Stable supply chains for dermatological products ensure business resilience, as confirmed by the revenue multiple for Longevity Health Holdings (XAGE). The current value of 3.90 serves as an indicator of market valuation. Partnerships with plastic surgeons to promote plasma biomaterials are driving sales growth, while Longevity Health Holdings (XAGE) accumulates its primary capital through the sale of regenerative cosmetics for tissue rejuvenation.

XAGE carmellcosmetics.com Market Cap to Revenue (04/04/2025 - 09/27/2025)

Longevity Health Holdings Inc (XAGE) - metric breakdowns and financial figures
Summary company analytics:XAGE - carmellcosmetics.com
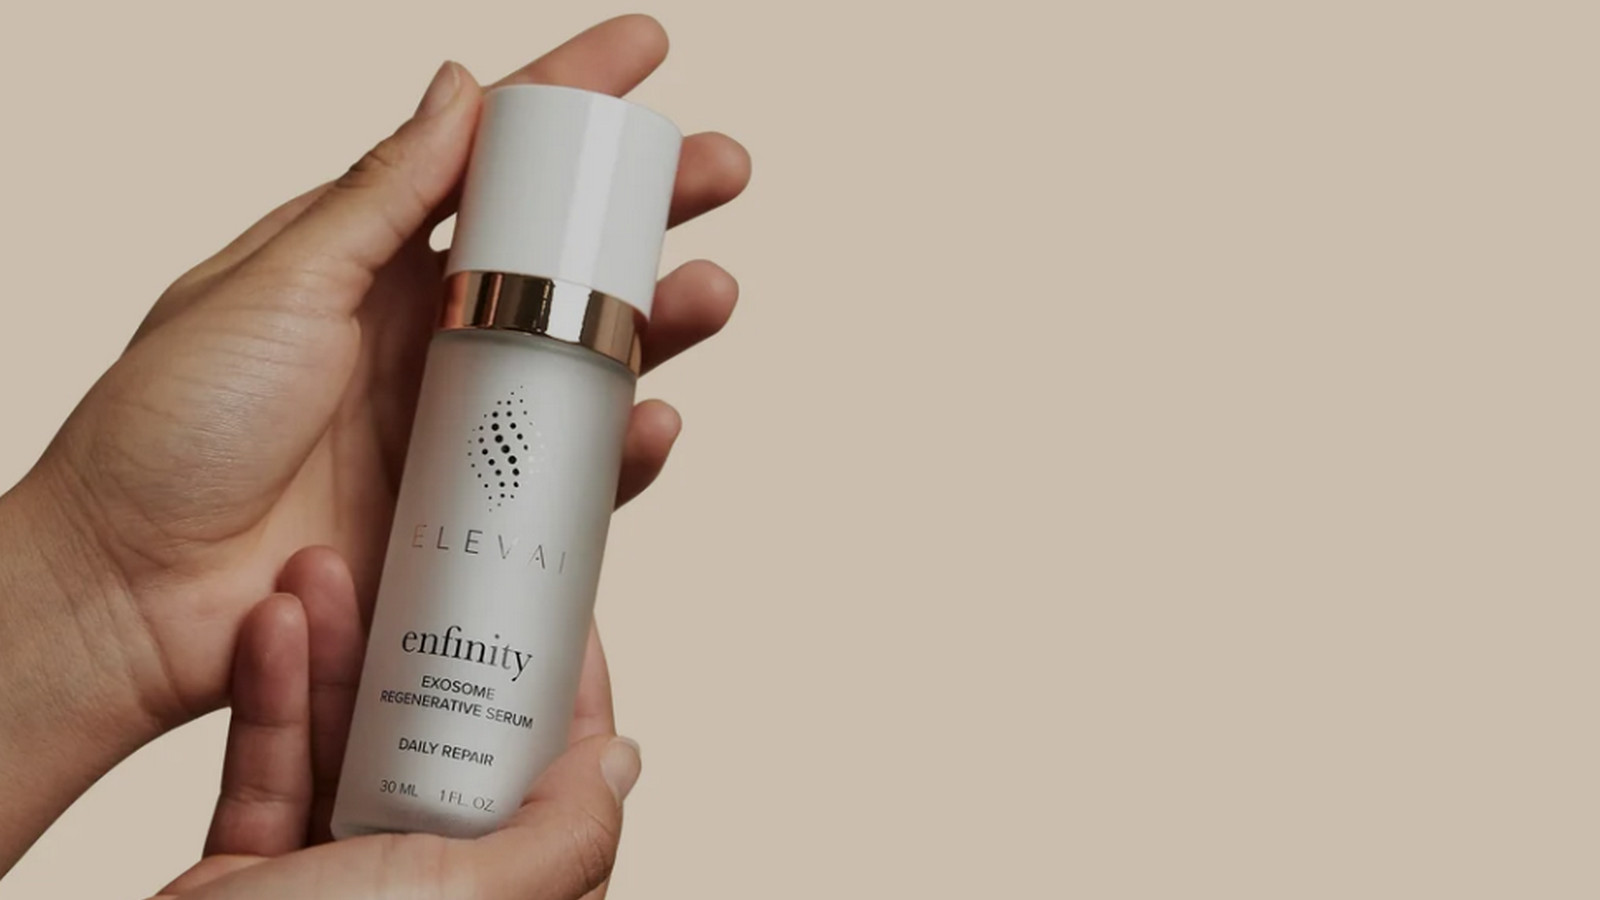
Core merchandise of Carmell Therapeutics Corporation

The P/S multiple reflects the market value of one dollar of revenue by relating the total market capitalization of Longevity Health Holdings (XAGE) to its sales volume to assess investment attractiveness. By analyzing the price-to-sales dynamics, an investor can discern market expectations for business scaling within aesthetic medicine, where the high margins of patented products ensure sustainable revenue growth regardless of macroeconomic cycles.

Who Longevity Health Holdings competes with

hcahealthcare.com - Market Cap to Revenue Ratio|P/S Multiple THC (Tenet Healthcare Corporation)|Price-to-Revenue Multiple Fresenius Medical Care AG|Solventum Inc. - P/S Multiple|Price to Sales Encompass|UHS (uhsinc.com) - Market Cap to Revenue|DVA (davita.com) - Price-to-Revenue Ratio|RDNT (RadNet) - P/S Multiple|Option Care (OPCH) - Price-to-Revenue Coefficient|Market Cap to Revenue SGRY (Surgery Partners Corp)|Market Cap to Sales Volume PINC|National Vision Holdings - Market Cap to Revenue|progyny.com (PGNY) - Price to Sales|ARDT: Market Cap to Revenue|Market Capitalization-to-Revenue Ratio SEM (Select Medical Corporation)|ASTH: P/S Multiple|MEDNAX - Market Capitalization-to-Revenue Ratio|USPH (US Physical Therapy) - P/S Multiple|Price to Sales pennantgroup.com PNTG|P/S Multiple ORGO|P/S Multiple Nutex Health Inc (NUTX)|Price-to-Revenue Ratio Auna Health AUNA|SBC Medical Group Holdings - Price-to-Revenue Ratio|EOLS: Market Cap to Revenue|chs.net - Market Cap to Sales Volume|SKIN: P/S Multiple|MediWound - Market Capitalization-to-Revenue Ratio|Market Cap to Revenue BTMD|JYNT: Market Capitalization-to-Revenue Ratio|P/S Multiple DCGO|PIII (p3hp.org) - Market Capitalization-to-Revenue Ratio|Price-to-Revenue Ratio Gain Therapeutics GANX|EUDA Health Holdings (EUDA) - Price to Sales|BMGL - Price-to-Revenue Ratio|CLGN: Price-to-Revenue Ratio|CUPR: P/S Multiple|Market Cap to Revenue Ratio CCM|AMS (American Shared Hospital Services) - P/S Multiple|MEDIROM Healthcare Group Inc. (MRM) - Price-to-Revenue Coefficient|Price-to-Revenue Ratio Avalon GloboCare (ALBT)|DIH Group - Market Cap to Revenue Ratio|P/S Multiple NIVF (NewGenIvf Group Limited)|Price-to-Revenue Multiple ATI Physical Therapy Inc.|CMAX - Price-to-Revenue Ratio|Price-to-Revenue Coefficient Kindly MD Inc KDLY|MODV (LogistiCare) - Market Cap to Revenue|Market Cap to Revenue Ratio NVOS|SSY (SunLink Health Systems Inc.) - P/S Multiple|P/S Multiple imacholdings.comm