freseniusmedicalcare.com (FMS) Company Gross Revenue

Corporate emblem and logo of Fresenius Medical Care AG (FMS)

Logistics disruptions in conflict zones are creating financial challenges for Fresenius Medical Care. Analyzing the company's revenue chart reveals consumer demand dynamics, where the latest value is recorded as 22.63. A steady patient inflow and a global network of plants ensure the business's operational resilience, despite intense pressure from US regulators regarding payments.

FMS freseniusmedicalcare.com: Company Revenue in the range 07/04/2022 - 11/16/2026

Analytical breakdowns for Fresenius Medical Care AG (FMS)
- market price and analyst price targets:
Comprehensive company analysis:Fresenius Medical Care
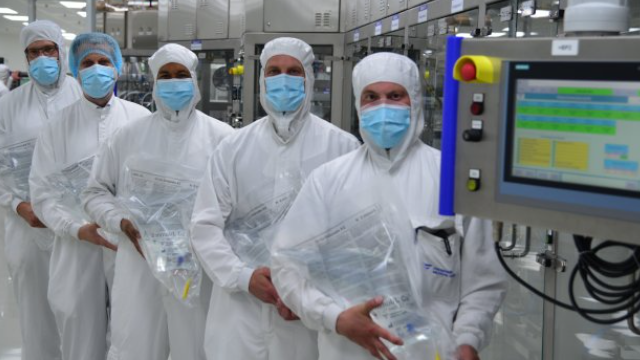
Manufactured product of Fresenius Medical Care AG & Co. KGaA

This metric reflects the net intensity of incoming cash flows from core operations. Daily revenue monitoring neutralizes random fluctuations, exposing the true vector of the business's fundamental development. For Fresenius Medical Care (FMS), revenue growth confirms the effectiveness of implementing water-saving technologies and ESG standards across dialysis centers. By analyzing corporate sales dynamics, an investor can identify operational risks in a timely manner. A stable trend here signals high resilience of market share.

Competing companies

Revenue and Sales Volume HCA Healthcare|Revenue and Sales Volume THC|Company Revenue SOLV (Solventum Inc.)|Company Revenue Encompass EHC|Universal Health Services (UHS) - Company Total Revenue|DaVita Corp - Revenue and Sales Volume|Company Total Revenue RadNet|Option Care Health Inc (OPCH) - Company Revenue|Surgery Partners Corp - Company Sales Revenue|Company Revenue Premier Corp|Company Revenue EYE|Company Sales PGNY (Progyny, Inc.)|ARDT (Ardent Health Partners, Inc.) - Company Sales Revenue|Revenue and Sales Volume SEM (Select Medical Corp)|Company Sales Revenue ASTH|Pediatrix Medical - Revenue and Sales Volume|Company Gross Revenue usph.com USPH|PNTG (Pennant Group Inc) - Company Sales|ORGO - Company Gross Revenue|NUTX (Nutex Health) - Revenue and Sales Volume|AUNA (Auna S.A.) - Company Total Sales|Company Revenue SBC Medical Group (SBC)|EOLS - Company Total Revenue|Community Health Systems Inc - Company Sales|Revenue and Sales Volume The Beauty Health SKIN|MDWD - Company Revenue|BTMD (Biote Corp) - Company Sales Volume|The Joint Chiropractic (JYNT) - Company Revenue|DocGo Inc - Company Sales Revenue|PIII - Company Sales Revenue|Gain Therapeutics (GANX) - Company Gross Revenue|Revenue and Sales Volume EUDA|Revenue and Sales Volume Basel Medical (BMGL)|Company Revenue CollPlant Biotechnologies Ltd. CLGN|Revenue and Sales Volume Cuprina Holdings (Cayman) Ltd CUPR|concordmedical.com - Revenue and Sales Volume|Company Gross Revenue American Shared Hospital Services AMS|MRM: Revenue and Sales Volume|ALBT: Company Total Sales|DHAI (DIH Holding US) - Revenue and Sales Volume|Carmell Corp (XAGE) - Company Gross Revenue|Revenue and Sales Volume NIVF|Company Gross Revenue ATI Physical Therapy Inc.|Company Revenue CareMax Medical Group CMAX|KDLY - Company Sales|modivcare.com - Revenue and Sales Volume|NVOS (Novo Integrated Sciences) - Company Sales Volume|SunLink Health Systems, Inc (SSY) - Company Revenue|IMAC Holdings (BACK) - Revenue and Sales Volume