FPI: Farmland Partners Inc Market Cap to Revenue

Corporate company logo of Farmland Partners Inc (FPI)

Farmland Partners Inc. (FPI) owns a unique portfolio of US farmland protected from market dumping. The fund's revenues are based on rental rates and global grain prices. Comparing the P/S multiple on GURU.Markets, we see that the value 7.40 captures this metric. This chart confirms the company's long-term pricing power, driven by the global shortage of fertile land and stable demand for food.

Farmland Partners Inc. (FPI): P/S Multiple from 07/04/2022 to 11/13/2026

Analytical breakdowns for Farmland Partners REIT (FPI)
- current quotes and average value forecast:
Summary company analytics:farmlandpartners.com - FPI
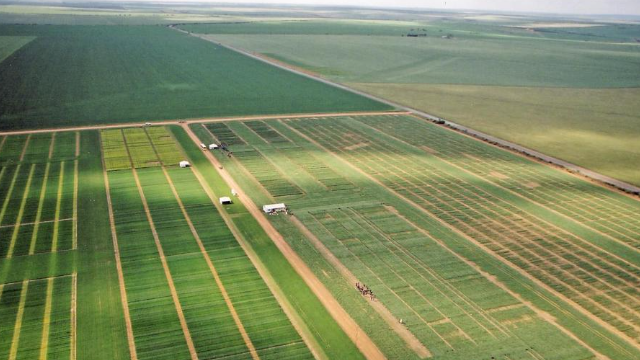
Product sample of Farmland Partners Inc.

The P/S ratio determines the market value of one dollar of revenue by comparing the total capitalization of Farmland Partners Inc. (FPI) with its operating income. By analyzing the price-to-sales ratio on GURU.Markets, an investor assesses the monetization efficiency of agricultural assets and land leases, which helps determine the fair value of the business within the context of global food supply chains.

Competing companies

WELL - Price to Sales|P/S Multiple DLR (Digital Realty)|VICI - Market Cap to Revenue|Extra Space Storage Corp - P/S Multiple|Price-to-Revenue Coefficient Ventas REIT VTR|IRM: P/S Multiple|suncommunities.com (SUI) - P/S Multiple|Price-to-Revenue Ratio Alexandria Real Estate|Price-to-Revenue Ratio GLPI|P/S Multiple DOC|Price-to-Revenue Coefficient Equity LifeStyle Properties Inc|Omega Healthcare Investors - Market Cap to Revenue|CUBE (cubesmart.com) - Price-to-Sales Ratio|CareTrust REIT - P/S Multiple|Price to Sales COPT Defense|WH: P/S Multiple|Market Cap to Revenue Ratio HR|SBRA (Sabra Health Care REIT) - P/S Multiple|EPR Properties Inc. - Price-to-Sales Ratio|P/S Multiple NSA|P/S Multiple Americold Realty Trust Inc. (COLD)|Price-to-Revenue Ratio National Health Investors Inc NHI|Market Capitalization-to-Revenue Ratio BNL|MPW - Price-to-Revenue Ratio|applehospitalityreit.com (APLE) - Market Cap to Revenue|DigitalBridge (DBRG) - Price-to-Revenue Ratio|SHO (Sunstone REIT) - Price-to-Revenue Ratio|DRH (DiamondRock) - P/S Multiple|P/S Multiple Innovative Industrial Corp|Price-to-Revenue Ratio SmartStop Self Storage REIT, Inc. (SMA)|silarealtytrust.com - Market Cap to Revenue Ratio|P/S Multiple XHR (Xenia Hotels & Resorts, Inc.)|SAFE: Market Cap to Revenue Ratio|RLJ: Market Cap to Revenue|Market Capitalization-to-Revenue Ratio DHC (Diversified Healthcare Trust)|Summit Hotel Properties (INN) - Price-to-Revenue Ratio|Price-to-Sales Ratio UHT (Universal Health REIT)|GMRE (Global Medical REIT Inc.) - P/S Multiple|P/S Multiple Postal Realty Trust Inc|Price-to-Revenue Ratio SVC REIT (SVC)|CHCT (CHCT REIT) - Market Capitalization-to-Revenue Ratio|Chatham Lodging Trust - Market Cap to Revenue|Market Cap to Sales Volume LAND (gladstonefarms.com)|STRW - Price-to-Revenue Ratio|SELF (Global Self Storage) - Market Cap to Revenue Ratio|AHT: P/S Multiple|Price to Sales InnSuites Hospitality Trust (IHT)|Price-to-Revenue Ratio Power REIT|HTIBP: Market Capitalization-to-Revenue Ratio|Price-to-Revenue Ratio Regional Health Properties (RHE)