IRM: Iron Mountain Inc. Market Cap to Revenue
Corporate company logo of Iron Mountain Inc. (IRM)

Iron Mountain attracts investors through its transition from physical archives to cloud storage and data centers. The price/sales ratio dynamics clearly confirm this trend, with the latest reading standing at 4.40. Strict regulatory barriers and the trust of government agencies form the business foundation, while its status as an environmental leader is solidified by the use of renewable energy in new data centers.

Iron Mountain (IRM): P/S Multiple from 07/04/2022 to 11/13/2026

Analytical breakdowns for Iron Mountain Corp (IRM)
- current quotes and average value forecast:
Summary company analytics:ironmountain.com - IRM
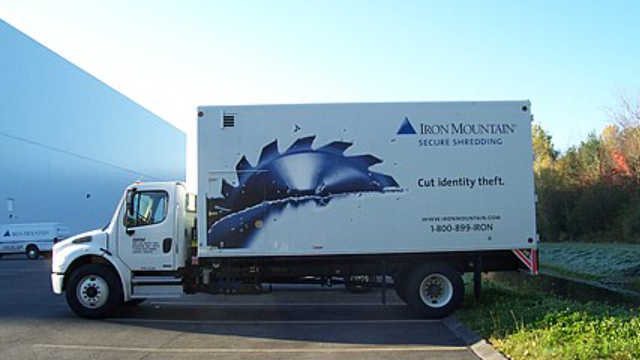
Product sample of Iron Mountain

Conservative capital demands transparency, which is why the market capitalization-to-annual revenue ratio serves as an objective measure of business value relative to actual sales. For Iron Mountain (IRM), with its predictable archival revenues and absence of cash flow gaps, this indicator confirms the stability of the model, allowing the company's P/S monitoring to determine the balance between overpayment risk and growth potential.

Competing companies

WELL - Price to Sales|P/S Multiple DLR (Digital Realty)|VICI - Market Cap to Revenue|Extra Space Storage Corp - P/S Multiple|Price-to-Revenue Coefficient Ventas REIT VTR|SUI: P/S Multiple|Alexandria Real Estate Equities (ARE) - P/S Multiple|Price-to-Revenue Ratio Gaming & Leisure Properties|Price-to-Revenue Ratio DOC|P/S Multiple ELS|Price-to-Revenue Coefficient Omega Healthcare Investors Inc|CubeSmart - Market Cap to Revenue|CTRE (caretrustreit.com) - Price-to-Sales Ratio|Corporate Office Properties Trust - P/S Multiple|Price to Sales Wyndham Hotels & Resorts, Inc.|HR: P/S Multiple|Market Cap to Revenue Ratio SBRA|EPR (EPR Properties Corp) - P/S Multiple|nationalstorageaffiliates.com (NSA) - Price-to-Revenue Coefficient|Price-to-Revenue Ratio Americold (COLD)|NHI (NHI REIT) - Market Capitalization-to-Revenue Ratio|Price-to-Revenue Ratio Broadstone REIT BNL|Medical Properties Trust Corp (MPW) - Price to Sales|APLE - Price-to-Revenue Ratio|DBRG (clny.com) - Market Cap to Revenue Ratio|SHO (Sunstone Hotel Investors, Inc.) - Market Cap to Revenue|drhc.com - Market Capitalization-to-Revenue Ratio|Price-to-Revenue Ratio Innovative Industrial Properties REIT|Market Cap to Revenue SmartStop Self Storage (SMA)|Price-to-Revenue Ratio Sila Realty Trust, Inc. (SILA)|XHR - Price to Sales|Safehold - Market Cap to Revenue|P/S Multiple RLJ Lodging RLJ|DHC - Price-to-Revenue Ratio|INN (Summit Hotel Corp) - Market Cap to Revenue Ratio|UHT (Universal Health Realty) - Market Cap to Revenue|GMRE: Market Cap to Sales Volume|FPI (Farmland Partners) - P/S Multiple|P/S Multiple Postal Realty Trust Inc|P/S Multiple SVC|Price-to-Revenue Coefficient CHCT REIT|Price-to-Revenue Ratio Chatham Lodging Trust CLDT|LAND: Market Cap to Revenue Ratio|Strawberry Fields REIT Inc. - P/S Multiple|Price-to-Revenue Coefficient Global Self Storage SELF|ahtreit.com (AHT) - Price-to-Revenue Ratio|InnSuites Hospitality Trust - Market Capitalization-to-Revenue Ratio|Price-to-Revenue Ratio Power REIT|Market Cap to Revenue Healthcare Trust REIT (HTIBP)|P/S Multiple RHE