Fisker Inc. (FSR) - Price to Earnings Ratio

Fisker Automotive - graphic logo of issuer FSR

Fisker Inc (FSR) is currently adapting to shifting consumer habits by cutting costs to preserve profits. The electric vehicle business is highly dependent on credit conditions and investment inflows, with the current metric standing at -0.10. The trajectory of the market capitalization confirms the company's critical vulnerability, as it has fully delegated assembly to external contractors, leaving it without its own factories.

FSR (Fisker) P/E Multiple history from 07/04/2022 to 04/06/2024
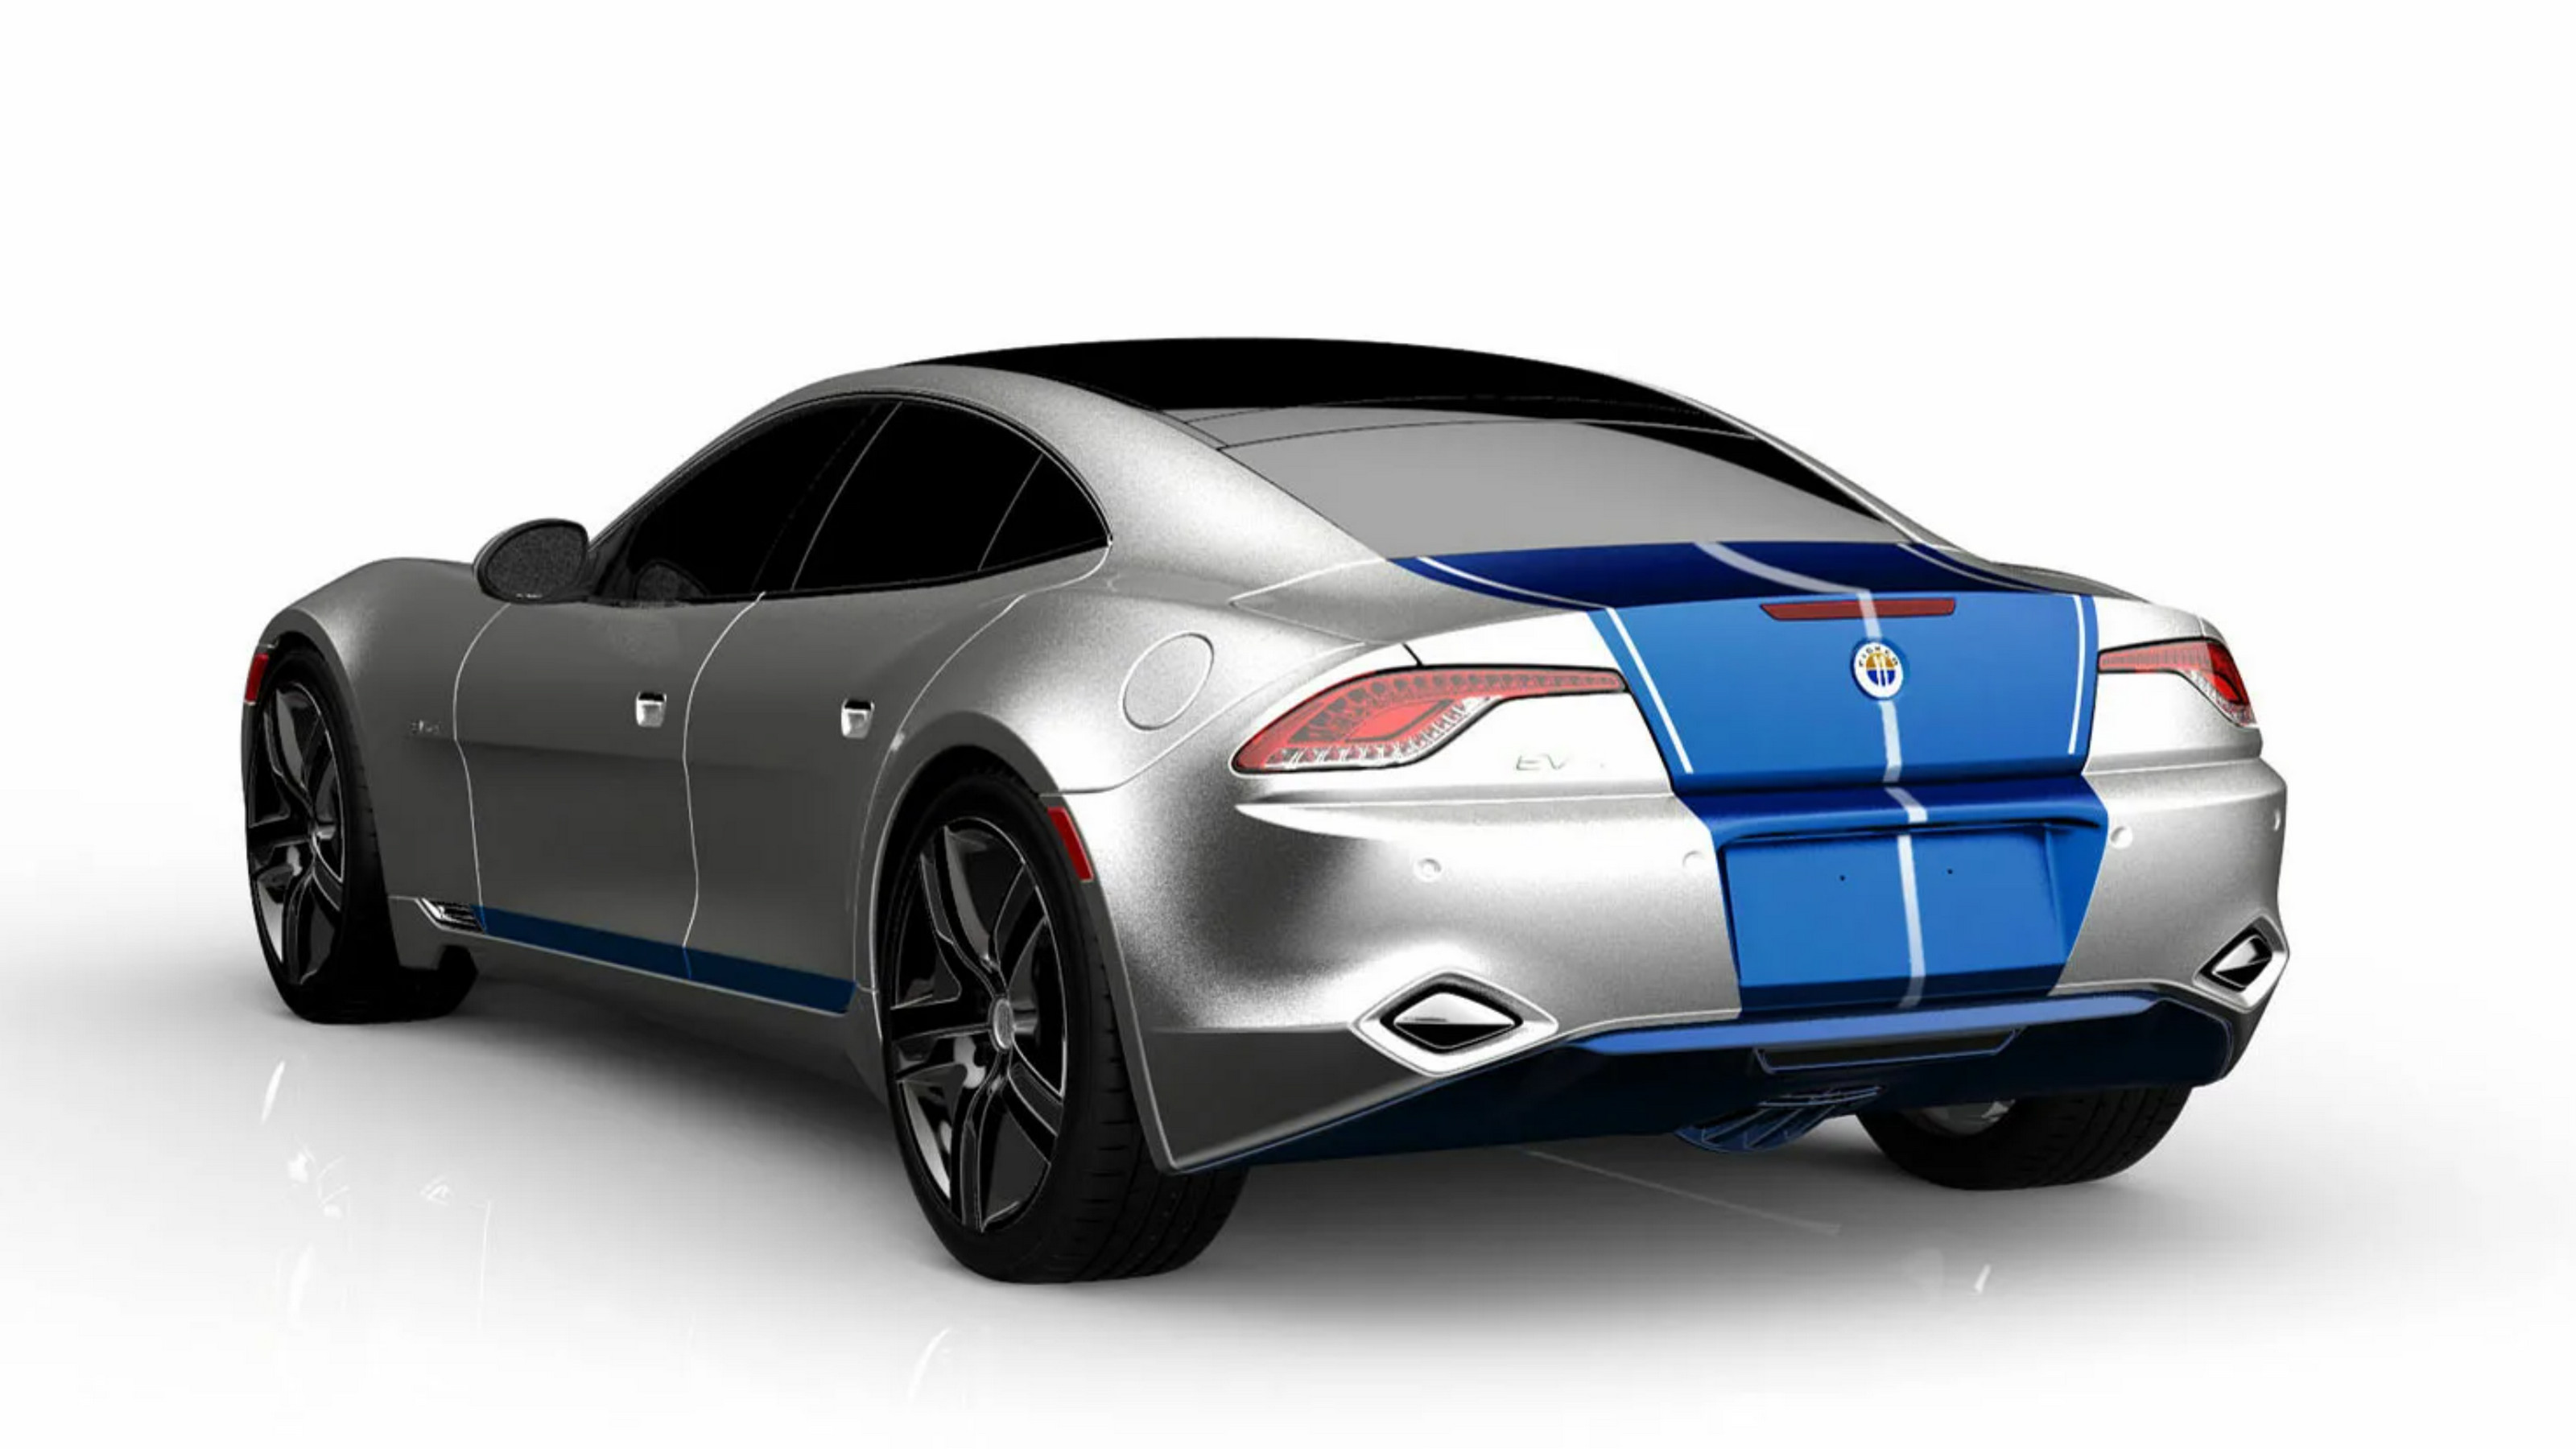
Manufactured product of Fisker Automotive

The efficiency of electric vehicle assembly outsourcing is directly reflected in the dynamics of the current P/E multiple for Fisker Inc (FSR). This ratio compares the business's market value to its net income, determining the investment payback period. Analyzing the relationship between capitalization and earnings allows for an assessment of market expectations regarding the asset-light model. Sharp fluctuations in this indicator signal either an asset revaluation or stagnation. It is critical for investors to distinguish between undervaluation and the fundamental decline of the company.

Analysis of competing companies

tesla.com (TSLA) - Business Payback Period|P/E Multiple LI|Price to Earnings Ratio Rivian Automotive RIVN|P/E Multiple XPEV (Xiaopeng Motors)|NIO (NIO Auto) - Market Cap to Net Income|Joby Aviation, Inc. - P/E Multiple|Business Payback Period ZEEKR Intelligent Technology Holding Limited ZK|VinFast (VFS) - Price to Earnings Ratio|LCID - Business Payback Period|Price to Earnings Ratio QuantumScape Inc.|P/E Multiple Polestar Corp|P/E Multiple ENVX|AMPX - Market Cap to Earnings|Price to Earnings Ratio EVgo EVGO|Company Value to Net Income LOT|MVST: Price to Earnings Ratio|Company Value to Net Income LVWR (LiveWire Corp)|SLDP: P/E Multiple|AIIO - Business Payback Period|Price to Earnings Ratio Hyliion|Price to Earnings Multiple NIU (Niu Tech)|P/E Multiple ELVA|Price to Earnings Ratio Faraday Future Inc. FFAI|P/E Multiple CHPT (ChargePoint Holdings)|ABAT (americanbatterytechnology.com) - Market Cap to Net Income|NVX - Price to Earnings Ratio|Business Payback Period Blink Charging Co. BLNK|Kandi Technologies Group, Inc. (KNDI) - Price to Earnings Ratio|CBAK Tech - Company Value to Net Income|WBX (Wallbox N.V.) - P/E Multiple|Market Cap to Earnings xcharge.com XCH|Price to Earnings Ratio Jiuzi Holdings, Inc. (JZXN)|Price to Earnings Ratio BEEM (Beam Global Inc)|P/E Multiple ZOOZ (ZOOZ Power)|Cenntro Inc (CENN) - Market Cap to Earnings|Stardust Power Corp - P/E Multiple|Greenland Technologies (GTEC) - Price to Earnings Ratio|EPOW (Sunrise New Energy) - Price to Earnings Ratio|XOS: Market Price to Net Income Ratio|Price to Earnings Ratio Dragonfly Energy Corp|WKHS: Company Value to Net Income|P/E Multiple ELPW|Business Payback Period sono-solar.com|P/E Multiple FLYE (Fly-E Group)|STI - Price to Earnings Ratio|GreenPower - P/E Multiple|Market Cap to Net Income UCAR|EVTV: P/E Multiple|LOBO - Business Payback Period|Price to Earnings Ratio Nuvve|Chijet Motor Company Inc (CJET) - Business Payback Period|Price to Earnings Ratio NaaS (NAAS)|P/E Multiple ezgotech.com.cn (EZGO)|P/E Multiple BINI (Bollinger Innovations)|Scage International Limited (SCAG) - Market Cap to Earnings|AIEV - Price to Earnings Ratio|Company Value to Net Income ALLG (Allego N.V.)|AYRO (ayro.com) - Price to Earnings Ratio|ff.com - Company Value to Net Income|GOEV (Canoo Inc) - P/E Multiple|Hyzon (HYZN) - Business Payback Period|Price to Earnings Ratio The Lion Electric Company (LEV)|Mullen Automotive - Price to Earnings Multiple|P/E Multiple PEV (Phoenix Motor Inc)|SVMH - Price to Earnings Ratio|Volcon ePowersports - P/E Multiple|Market Cap to Net Income ZAPP