Mullen Automotive (MULN) - Business Payback Period

Symbol and logo of brand Mullen Automotive Inc (MULN)

The share price history of Mullen Automotive, Inc. (MULN) reflects the dynamics of an electric vehicle manufacturer where the indicator stands at 0.00. A critical asset imbalance and liquidity shortage threaten the business's continued existence. Delisting risks and a lack of stable sales further exacerbate the situation. Meanwhile, management is pursuing rapid growth through the acquisition of external capacities and the implementation of innovative batteries to capture the commercial segment.

Price to Earnings Ratio: Mullen (MULN) for 07/04/2022 - 07/28/2025

Analytical breakdowns for Mullen Automotive, Inc.
Comprehensive company analysis:Mullen
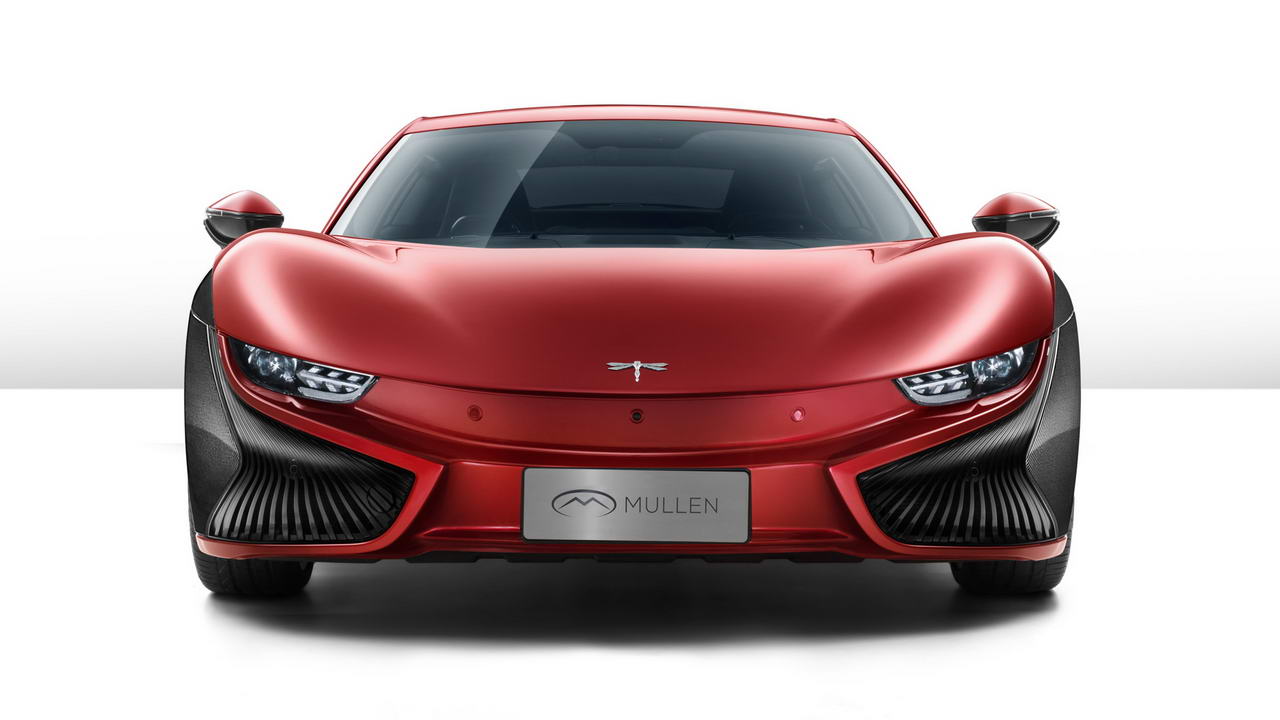
Core merchandise of Mullen Motors

The scale of Mullen Automotive, Inc. (MULN) determines the dynamics of the company's P/E ratio. This coefficient relates the current market value of the business to its annual net income. The metric measures the density of invested capital and the degree of market optimism. For electric vans, a high figure often signals speculative overheating amid massive costs associated with launching production lines. A liquidity deficit makes such valuations extremely vulnerable.

Key competitors

TSLA: Company Value to Net Income|Price to Earnings Ratio Li Auto Corp (LI)|Business Payback Period Rivian Automotive Inc|P/E Multiple XPEV (xiaopeng.com)|NIO: Price to Earnings Multiple|JOBY - Price to Earnings Ratio|Market Cap to Earnings Zeekr EV|VinFast Auto (VFS) - Price to Earnings Ratio|Lucid Group (LCID) - P/E Multiple|Price to Earnings Ratio QS|Price to Earnings Ratio PSNY|Price to Earnings Ratio ENVX (Enovix)|AMPX (Amprius Technologies, Inc.) - Company Value to Net Income|EVgo Services - Price to Earnings Ratio|Company Value to Net Income LOT|MVST: Price to Earnings Ratio|Business Payback Period livewire.com LVWR|Solid Power, Inc. (SLDP) - Price to Earnings Ratio|AIIO - Business Payback Period|Price to Earnings Ratio HYLN|Price to Earnings Multiple NIU (niu.com)|P/E Multiple ELVA|FFAI: Market Cap to Net Income|Price to Earnings Ratio ChargePoint Network CHPT|American Battery Technology Company - Price to Earnings Ratio|NOVONIX Group - P/E Multiple|Market Cap to Net Income Ratio blinkcharging.com (BLNK)|Kandi Technologies Group (KNDI) - Price to Earnings Ratio|CBAK Energy - Company Value to Net Income|WBX (Wallbox) - P/E Multiple|Price to Earnings Ratio XCHG (XCH)|Price to Earnings Ratio Jiuzi (JZXN)|BEEM - Market Cap to Earnings|zoozpower.com - Price to Earnings Ratio|CENN: Price to Earnings Multiple|Stardust Power Inc - P/E Multiple|Market Cap to Earnings Greenland Technologies Holding Corp|EPOW: P/E Multiple|XOS - Business Payback Period|DFLI (Dragonfly Energy Holdings) - P/E Multiple|Price to Earnings Multiple WKHS (Workhorse Group Inc.)|P/E Multiple ELPW|SSM - Market Cap to Earnings|P/E Multiple FLYE (Fly-E Group)|Business Payback Period Solidion Technology Inc. (STI)|GP: Price to Earnings Ratio|UCAR: Price to Earnings Ratio|EVTV (evtvusa.com) - Price to Earnings Ratio|Market Cap to Earnings Lobo EV Technologies Limited (LOBO)|NVVE (nuvve.com) - P/E Multiple|Market Cap to Earnings Chijet Motor Company CJET|Price to Earnings Ratio enaas.com (NAAS)|EZGO: Market Cap to Net Income|P/E Multiple BINI (Bollinger Innovations Inc)|SCAG - Price to Earnings Ratio|AIEV: Price to Earnings Ratio|ALLG: Price to Earnings Ratio|AYRO: P/E Multiple|Market Cap to Net Income FFIE (Faraday Future Intelligent Electric)|Price to Earnings Ratio GOEV|Hyzon Motors Inc. (HYZN) - Business Payback Period|P/E Multiple LEV|PEV: Market Cap to Net Income|P/E Multiple SVMH (SRIVARU Holding Ltd.)|Company Value to Net Income VLCN|ZAPP: Price to Earnings Ratio|Market Cap to Net Income FSR