GHM: Graham Manufacturing Net earnings per share (EPS TTM)

Graphic logo of Graham Manufacturing (GHM)

Graham Corporation is developing advanced engineering for the defense sector while implementing sustainable standards and energy-efficient production cycles. This annual net income per share chart reflects operational efficiency dynamics, where the 1.16 mark serves as a key metric. Its status as an indispensable supplier to the nuclear energy and defense industries allows Graham Corporation to maintain premium pricing power for its unique systems.

GHM (Graham Industrial) Net earnings per one share for the last twelve months history from 07/04/2022 to 11/15/2026

Graham Corporation - analytical breakdowns and key metrics (GHM)
- share price and expert price forecast:
Basic company analysis:graham-mfg.com (GHM)
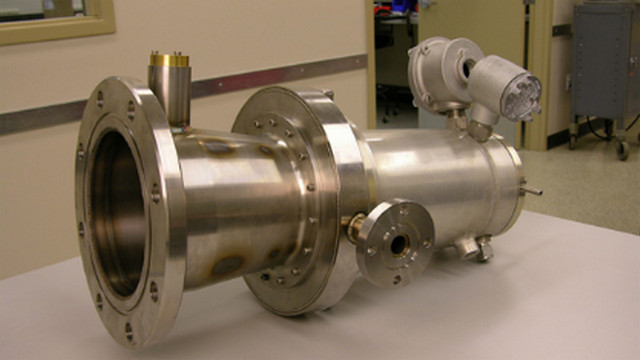
Flagship merchandise of Graham Industrial

When screening for issuer reliability, EPS TTM reflects the actual profit per share over a year, allowing investors to isolate one-time gains from systemic margin growth. By analyzing the rolling annual earnings per share trend on GURU.Markets, an investor can see how effectively Graham Corporation (GHM) converts synergies from the acquisition of defense assets into sustainable financial results, overcoming organic growth stagnation.

Analysis of competing companies

CAT: Net earnings per share for the last 12 months|Earnings per share for the trailing year GEV (GE Vernova)|LRCX (Lam Research Corp) - Net earnings per share for the last 12 months|United Rentals Corp - Earnings per share for the trailing year|GWW (W.W. Grainger) - Net earnings per share (EPS TTM)|Net earnings per one share for the last twelve months Wabtec WAB|Net earnings per share (EPS TTM) RBA|GTLS - Net earnings per one share for the last twelve months|Oshkosh Defense - Net earnings per share for the last 12 months|Federal Signal - Earnings per share for the last twelve months|GTES: Net earnings per share for the last 12 months|Net earnings per one share for the last twelve months Herc Holdings Inc.|TEX (Terex Corporation) - Net earnings per share for the last 12 months|HI - Net earnings per share for the last four quarters|CYD (Yuchai) - Net earnings per share (EPS TTM)|GBX: Earnings per share for the trailing year|Net earnings per share for the last 12 months CTOS (Custom Truck Corp)|GRC - Net earnings per one share for the last twelve months|Astec Industries, Inc. - Net earnings per share for the last 12 months|Aebi Schmidt - Earnings per share for the last twelve months|Douglas Dynamics Inc - Net earnings per share (EPS TTM)|Northwest Pipe Corp - Earnings per share for the last four quarters|Miller Industries, Inc. (MLR) - Earnings per share for the last twelve months|The Manitowoc Company (MTW) - Net earnings per share (EPS TTM)|ALTG (Alta Equipment Group Inc.) - Net earnings per share (EPS TTM)|GENC: Earnings per share for the trailing year|Net earnings per share (EPS TTM) TWIN|Net earnings per share for the last 12 months Coda Octopus Group Inc CODA|Earnings per share for the last twelve months Hongli Group Inc. HLP|BWEN: Earnings per share for the last 12 months|Rail Vision Ltd - Net earnings per share (EPS TTM)|TLIH - Net earnings per share (EPS TTM)|CLWT (Euro Tech Holdings Co. Ltd.) - Net earnings per share for the last 12 months|Multi Ways Holdings Ltd - Earnings per share for the trailing year|Earnings per share for the last twelve months Twin Vee Powercats Co|visionmarinetechnologies.com (VMAR) - Net earnings per share for the last four quarters|Earnings per share for the last twelve months H&E Equipment (HEES)|MNTX - Net earnings per one share for the last twelve months|Heramba Electric - Net earnings per share for the last 12 months|TPI Composites Inc (TPIC) - Net earnings per one share for the last twelve months|AEBIV: Net earnings per share for the last 12 months